Immigrants from Iraq vs Ghanaian Male Poverty
COMPARE
Immigrants from Iraq
Ghanaian
Male Poverty
Male Poverty Comparison
Immigrants from Iraq
Ghanaians
11.4%
MALE POVERTY
31.9/ 100
METRIC RATING
187th/ 347
METRIC RANK
12.7%
MALE POVERTY
0.4/ 100
METRIC RATING
239th/ 347
METRIC RANK
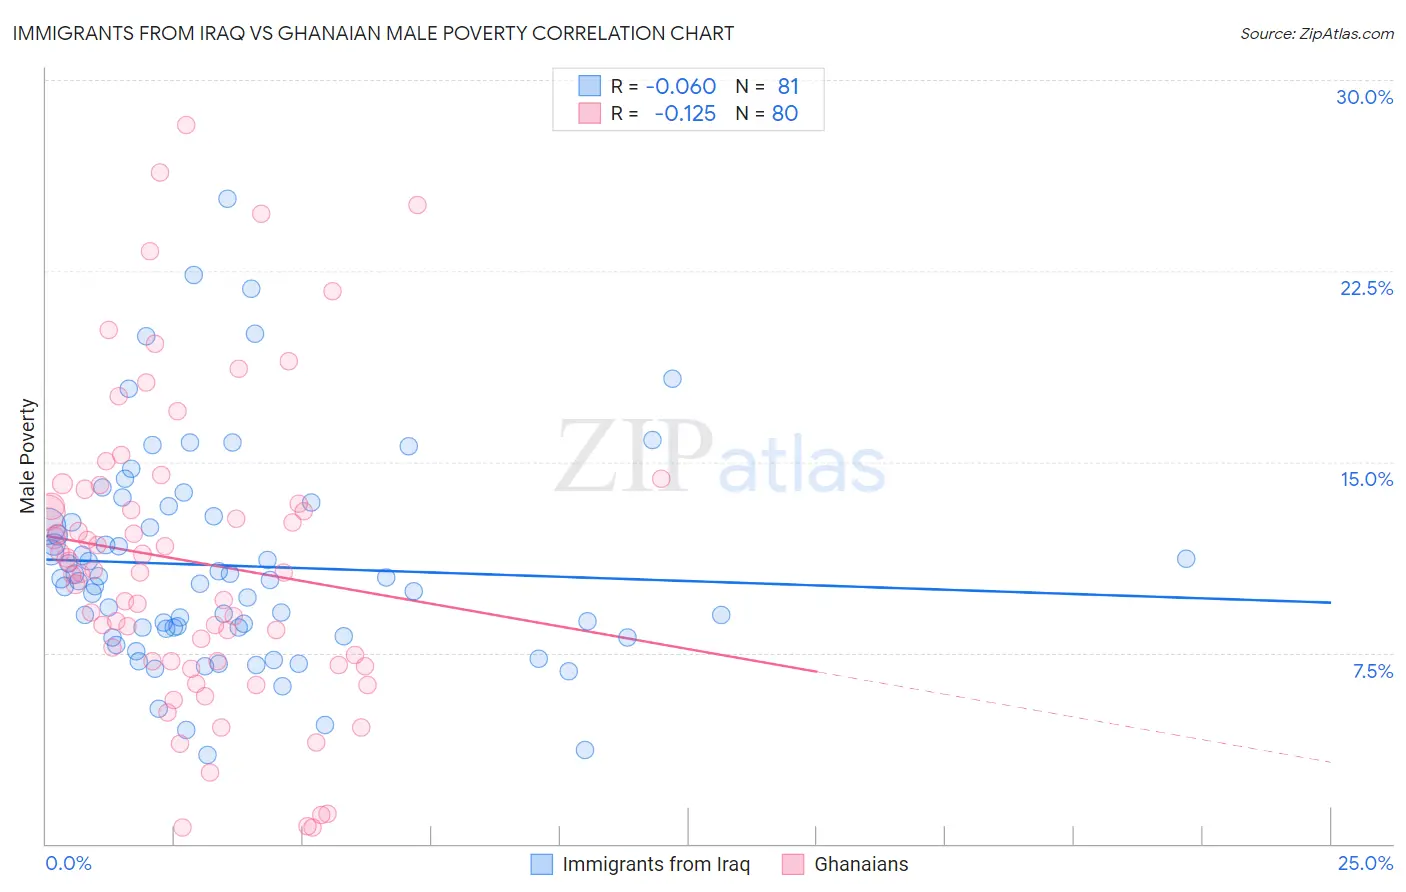
Immigrants from Iraq vs Ghanaian Male Poverty Correlation Chart
The statistical analysis conducted on geographies consisting of 194,696,024 people shows a slight negative correlation between the proportion of Immigrants from Iraq and poverty level among males in the United States with a correlation coefficient (R) of -0.060 and weighted average of 11.4%. Similarly, the statistical analysis conducted on geographies consisting of 190,493,527 people shows a poor negative correlation between the proportion of Ghanaians and poverty level among males in the United States with a correlation coefficient (R) of -0.125 and weighted average of 12.7%, a difference of 11.3%.
Male Poverty Correlation Summary
| Measurement | Immigrants from Iraq | Ghanaian |
| Minimum | 3.5% | 0.62% |
| Maximum | 25.3% | 28.3% |
| Range | 21.9% | 27.6% |
| Mean | 10.9% | 11.1% |
| Median | 10.3% | 10.7% |
| Interquartile 25% (IQ1) | 8.3% | 7.2% |
| Interquartile 75% (IQ3) | 12.8% | 13.6% |
| Interquartile Range (IQR) | 4.5% | 6.5% |
| Standard Deviation (Sample) | 4.2% | 6.0% |
| Standard Deviation (Population) | 4.2% | 5.9% |
Similar Demographics by Male Poverty
Demographics Similar to Immigrants from Iraq by Male Poverty
In terms of male poverty, the demographic groups most similar to Immigrants from Iraq are Immigrants from Sierra Leone (11.4%, a difference of 0.11%), Immigrants from Afghanistan (11.4%, a difference of 0.16%), Sierra Leonean (11.4%, a difference of 0.22%), Hawaiian (11.4%, a difference of 0.41%), and Immigrants from South America (11.3%, a difference of 0.54%).
| Demographics | Rating | Rank | Male Poverty |
| Immigrants | Morocco | 40.1 /100 | #180 | Average 11.3% |
| Immigrants | Costa Rica | 39.5 /100 | #181 | Fair 11.3% |
| Mongolians | 39.0 /100 | #182 | Fair 11.3% |
| Kenyans | 38.4 /100 | #183 | Fair 11.3% |
| Immigrants | South America | 36.9 /100 | #184 | Fair 11.3% |
| Immigrants | Afghanistan | 33.3 /100 | #185 | Fair 11.4% |
| Immigrants | Sierra Leone | 32.9 /100 | #186 | Fair 11.4% |
| Immigrants | Iraq | 31.9 /100 | #187 | Fair 11.4% |
| Sierra Leoneans | 29.9 /100 | #188 | Fair 11.4% |
| Hawaiians | 28.3 /100 | #189 | Fair 11.4% |
| Israelis | 26.1 /100 | #190 | Fair 11.5% |
| South American Indians | 22.8 /100 | #191 | Fair 11.5% |
| Immigrants | Uruguay | 19.1 /100 | #192 | Poor 11.6% |
| Immigrants | Kuwait | 17.3 /100 | #193 | Poor 11.6% |
| Immigrants | Kenya | 16.1 /100 | #194 | Poor 11.6% |
Demographics Similar to Ghanaians by Male Poverty
In terms of male poverty, the demographic groups most similar to Ghanaians are Ecuadorian (12.7%, a difference of 0.0%), French American Indian (12.7%, a difference of 0.030%), Immigrants from Saudi Arabia (12.7%, a difference of 0.080%), Immigrants from Middle Africa (12.7%, a difference of 0.27%), and Immigrants from Laos (12.6%, a difference of 0.33%).
| Demographics | Rating | Rank | Male Poverty |
| Nicaraguans | 0.6 /100 | #232 | Tragic 12.6% |
| Fijians | 0.6 /100 | #233 | Tragic 12.6% |
| Immigrants | Armenia | 0.6 /100 | #234 | Tragic 12.6% |
| Immigrants | Laos | 0.5 /100 | #235 | Tragic 12.6% |
| Immigrants | Saudi Arabia | 0.4 /100 | #236 | Tragic 12.7% |
| French American Indians | 0.4 /100 | #237 | Tragic 12.7% |
| Ecuadorians | 0.4 /100 | #238 | Tragic 12.7% |
| Ghanaians | 0.4 /100 | #239 | Tragic 12.7% |
| Immigrants | Middle Africa | 0.4 /100 | #240 | Tragic 12.7% |
| Sudanese | 0.3 /100 | #241 | Tragic 12.8% |
| Nepalese | 0.3 /100 | #242 | Tragic 12.8% |
| Alaskan Athabascans | 0.3 /100 | #243 | Tragic 12.8% |
| Tsimshian | 0.3 /100 | #244 | Tragic 12.8% |
| Liberians | 0.3 /100 | #245 | Tragic 12.8% |
| Immigrants | El Salvador | 0.2 /100 | #246 | Tragic 12.8% |