Immigrants from Dominican Republic vs Austrian Male Poverty
COMPARE
Immigrants from Dominican Republic
Austrian
Male Poverty
Male Poverty Comparison
Immigrants from Dominican Republic
Austrians
16.2%
MALE POVERTY
0.0/ 100
METRIC RATING
330th/ 347
METRIC RANK
10.1%
MALE POVERTY
97.8/ 100
METRIC RATING
61st/ 347
METRIC RANK
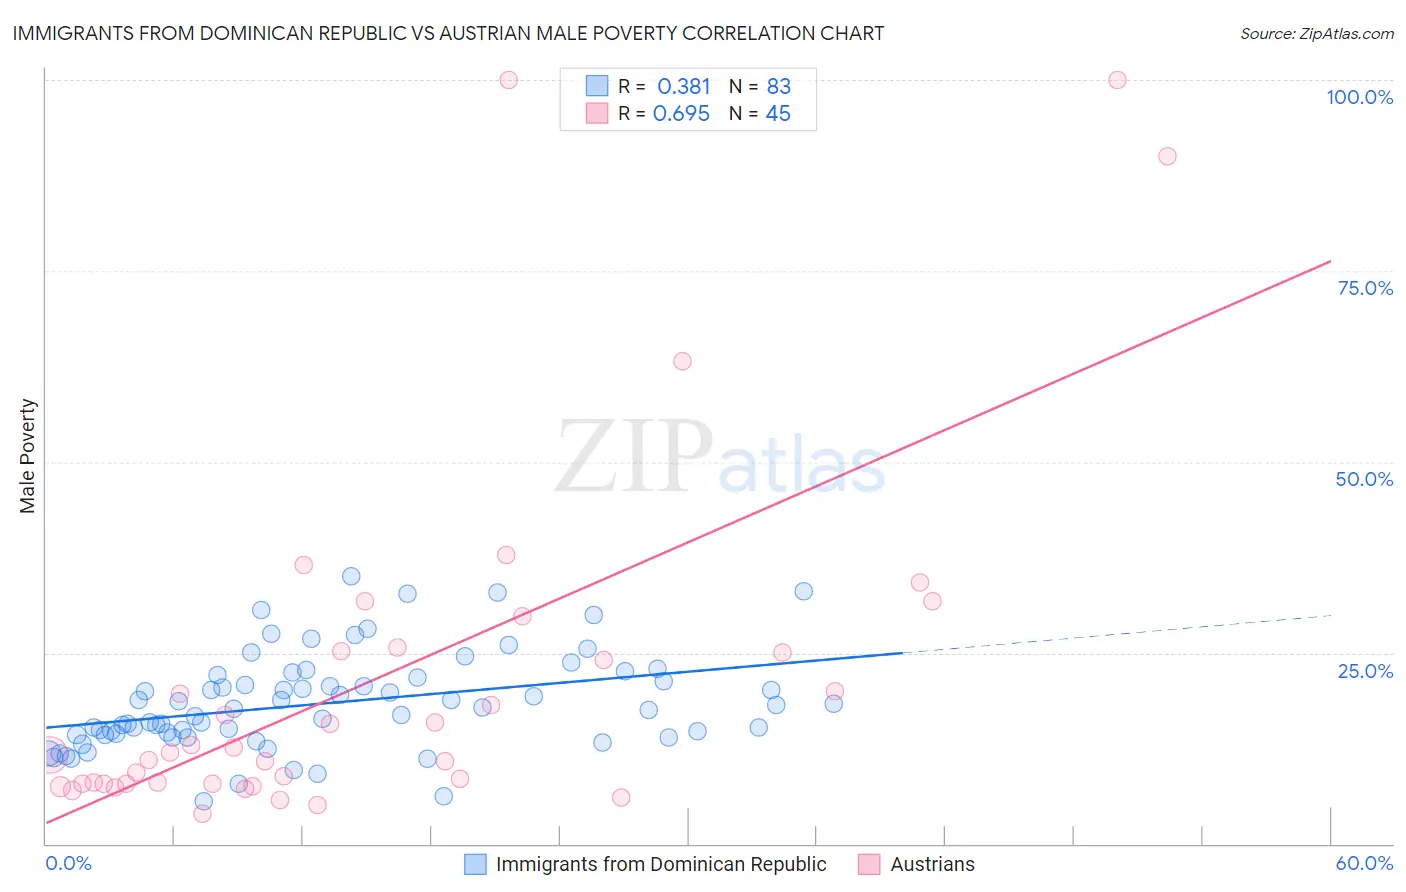
Immigrants from Dominican Republic vs Austrian Male Poverty Correlation Chart
The statistical analysis conducted on geographies consisting of 274,910,584 people shows a mild positive correlation between the proportion of Immigrants from Dominican Republic and poverty level among males in the United States with a correlation coefficient (R) of 0.381 and weighted average of 16.2%. Similarly, the statistical analysis conducted on geographies consisting of 451,474,043 people shows a significant positive correlation between the proportion of Austrians and poverty level among males in the United States with a correlation coefficient (R) of 0.695 and weighted average of 10.1%, a difference of 59.6%.
Male Poverty Correlation Summary
| Measurement | Immigrants from Dominican Republic | Austrian |
| Minimum | 5.5% | 4.0% |
| Maximum | 35.1% | 100.0% |
| Range | 29.5% | 96.0% |
| Mean | 18.4% | 21.7% |
| Median | 17.7% | 11.9% |
| Interquartile 25% (IQ1) | 14.2% | 7.9% |
| Interquartile 75% (IQ3) | 21.7% | 25.5% |
| Interquartile Range (IQR) | 7.5% | 17.6% |
| Standard Deviation (Sample) | 6.2% | 23.4% |
| Standard Deviation (Population) | 6.2% | 23.2% |
Similar Demographics by Male Poverty
Demographics Similar to Immigrants from Dominican Republic by Male Poverty
In terms of male poverty, the demographic groups most similar to Immigrants from Dominican Republic are Ute (16.2%, a difference of 0.34%), Dominican (16.1%, a difference of 0.65%), Black/African American (15.8%, a difference of 2.4%), Paiute (15.8%, a difference of 2.4%), and Houma (16.7%, a difference of 3.3%).
| Demographics | Rating | Rank | Male Poverty |
| Colville | 0.0 /100 | #323 | Tragic 15.2% |
| Menominee | 0.0 /100 | #324 | Tragic 15.3% |
| Yakama | 0.0 /100 | #325 | Tragic 15.3% |
| Central American Indians | 0.0 /100 | #326 | Tragic 15.3% |
| Paiute | 0.0 /100 | #327 | Tragic 15.8% |
| Blacks/African Americans | 0.0 /100 | #328 | Tragic 15.8% |
| Dominicans | 0.0 /100 | #329 | Tragic 16.1% |
| Immigrants | Dominican Republic | 0.0 /100 | #330 | Tragic 16.2% |
| Ute | 0.0 /100 | #331 | Tragic 16.2% |
| Houma | 0.0 /100 | #332 | Tragic 16.7% |
| Natives/Alaskans | 0.0 /100 | #333 | Tragic 16.9% |
| Cheyenne | 0.0 /100 | #334 | Tragic 17.6% |
| Apache | 0.0 /100 | #335 | Tragic 17.7% |
| Pueblo | 0.0 /100 | #336 | Tragic 18.5% |
| Sioux | 0.0 /100 | #337 | Tragic 18.7% |
Demographics Similar to Austrians by Male Poverty
In terms of male poverty, the demographic groups most similar to Austrians are Ukrainian (10.1%, a difference of 0.020%), Immigrants from Italy (10.2%, a difference of 0.090%), Immigrants from Europe (10.1%, a difference of 0.11%), Slovak (10.2%, a difference of 0.13%), and Scandinavian (10.1%, a difference of 0.24%).
| Demographics | Rating | Rank | Male Poverty |
| Immigrants | Austria | 98.5 /100 | #54 | Exceptional 10.0% |
| Germans | 98.3 /100 | #55 | Exceptional 10.1% |
| Immigrants | Bulgaria | 98.2 /100 | #56 | Exceptional 10.1% |
| Estonians | 98.1 /100 | #57 | Exceptional 10.1% |
| Scandinavians | 98.0 /100 | #58 | Exceptional 10.1% |
| Immigrants | Europe | 97.9 /100 | #59 | Exceptional 10.1% |
| Ukrainians | 97.9 /100 | #60 | Exceptional 10.1% |
| Austrians | 97.8 /100 | #61 | Exceptional 10.1% |
| Immigrants | Italy | 97.8 /100 | #62 | Exceptional 10.2% |
| Slovaks | 97.7 /100 | #63 | Exceptional 10.2% |
| Swiss | 97.5 /100 | #64 | Exceptional 10.2% |
| Zimbabweans | 97.5 /100 | #65 | Exceptional 10.2% |
| Serbians | 97.5 /100 | #66 | Exceptional 10.2% |
| Immigrants | Netherlands | 97.3 /100 | #67 | Exceptional 10.2% |
| Immigrants | Sri Lanka | 97.2 /100 | #68 | Exceptional 10.2% |