Immigrants from Dominican Republic vs Ghanaian Single Father Households
COMPARE
Immigrants from Dominican Republic
Ghanaian
Single Father Households
Single Father Households Comparison
Immigrants from Dominican Republic
Ghanaians
2.6%
SINGLE FATHER HOUSEHOLDS
0.2/ 100
METRIC RATING
275th/ 347
METRIC RANK
2.4%
SINGLE FATHER HOUSEHOLDS
12.9/ 100
METRIC RATING
220th/ 347
METRIC RANK
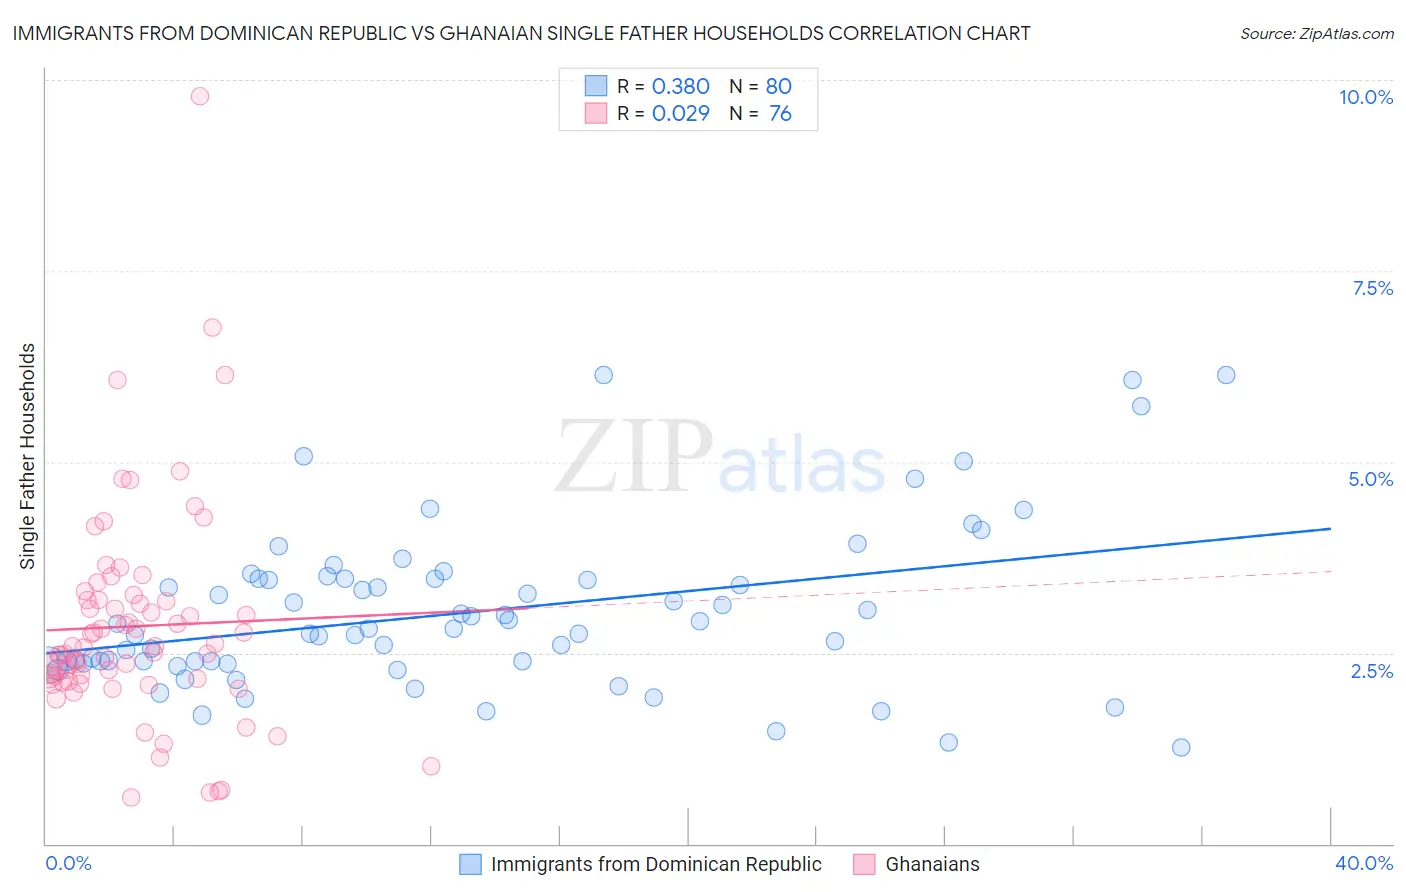
Immigrants from Dominican Republic vs Ghanaian Single Father Households Correlation Chart
The statistical analysis conducted on geographies consisting of 273,173,003 people shows a mild positive correlation between the proportion of Immigrants from Dominican Republic and percentage of single father households in the United States with a correlation coefficient (R) of 0.380 and weighted average of 2.6%. Similarly, the statistical analysis conducted on geographies consisting of 189,857,222 people shows no correlation between the proportion of Ghanaians and percentage of single father households in the United States with a correlation coefficient (R) of 0.029 and weighted average of 2.4%, a difference of 8.1%.
Single Father Households Correlation Summary
| Measurement | Immigrants from Dominican Republic | Ghanaian |
| Minimum | 1.3% | 0.61% |
| Maximum | 6.1% | 9.8% |
| Range | 4.9% | 9.2% |
| Mean | 3.0% | 2.8% |
| Median | 2.8% | 2.6% |
| Interquartile 25% (IQ1) | 2.4% | 2.1% |
| Interquartile 75% (IQ3) | 3.5% | 3.2% |
| Interquartile Range (IQR) | 1.1% | 1.0% |
| Standard Deviation (Sample) | 1.1% | 1.4% |
| Standard Deviation (Population) | 1.1% | 1.4% |
Similar Demographics by Single Father Households
Demographics Similar to Immigrants from Dominican Republic by Single Father Households
In terms of single father households, the demographic groups most similar to Immigrants from Dominican Republic are Immigrants from Haiti (2.6%, a difference of 0.21%), Shoshone (2.6%, a difference of 0.24%), Cherokee (2.6%, a difference of 0.29%), Samoan (2.6%, a difference of 0.33%), and Puerto Rican (2.6%, a difference of 0.42%).
| Demographics | Rating | Rank | Single Father Households |
| Haitians | 0.4 /100 | #268 | Tragic 2.6% |
| Cubans | 0.3 /100 | #269 | Tragic 2.6% |
| Seminole | 0.3 /100 | #270 | Tragic 2.6% |
| Creek | 0.2 /100 | #271 | Tragic 2.6% |
| Belizeans | 0.2 /100 | #272 | Tragic 2.6% |
| Iroquois | 0.2 /100 | #273 | Tragic 2.6% |
| Puerto Ricans | 0.2 /100 | #274 | Tragic 2.6% |
| Immigrants | Dominican Republic | 0.2 /100 | #275 | Tragic 2.6% |
| Immigrants | Haiti | 0.1 /100 | #276 | Tragic 2.6% |
| Shoshone | 0.1 /100 | #277 | Tragic 2.6% |
| Cherokee | 0.1 /100 | #278 | Tragic 2.6% |
| Samoans | 0.1 /100 | #279 | Tragic 2.6% |
| Immigrants | Portugal | 0.1 /100 | #280 | Tragic 2.6% |
| Nicaraguans | 0.1 /100 | #281 | Tragic 2.6% |
| Dutch West Indians | 0.1 /100 | #282 | Tragic 2.6% |
Demographics Similar to Ghanaians by Single Father Households
In terms of single father households, the demographic groups most similar to Ghanaians are Sudanese (2.4%, a difference of 0.010%), Immigrants from Ethiopia (2.4%, a difference of 0.080%), Immigrants from Burma/Myanmar (2.4%, a difference of 0.13%), Immigrants from Eastern Africa (2.4%, a difference of 0.16%), and Dutch (2.4%, a difference of 0.21%).
| Demographics | Rating | Rank | Single Father Households |
| Norwegians | 17.1 /100 | #213 | Poor 2.4% |
| Ethiopians | 16.6 /100 | #214 | Poor 2.4% |
| Immigrants | South Eastern Asia | 15.9 /100 | #215 | Poor 2.4% |
| Immigrants | Ecuador | 14.9 /100 | #216 | Poor 2.4% |
| Dutch | 14.3 /100 | #217 | Poor 2.4% |
| Immigrants | Ethiopia | 13.4 /100 | #218 | Poor 2.4% |
| Sudanese | 13.0 /100 | #219 | Poor 2.4% |
| Ghanaians | 12.9 /100 | #220 | Poor 2.4% |
| Immigrants | Burma/Myanmar | 12.1 /100 | #221 | Poor 2.4% |
| Immigrants | Eastern Africa | 11.9 /100 | #222 | Poor 2.4% |
| Immigrants | Uruguay | 11.0 /100 | #223 | Poor 2.4% |
| Immigrants | Bahamas | 10.6 /100 | #224 | Poor 2.4% |
| Marshallese | 9.7 /100 | #225 | Tragic 2.4% |
| Blacks/African Americans | 9.7 /100 | #226 | Tragic 2.4% |
| Americans | 9.3 /100 | #227 | Tragic 2.4% |