Immigrants from Netherlands vs Ghanaian Male Poverty
COMPARE
Immigrants from Netherlands
Ghanaian
Male Poverty
Male Poverty Comparison
Immigrants from Netherlands
Ghanaians
10.2%
MALE POVERTY
97.3/ 100
METRIC RATING
67th/ 347
METRIC RANK
12.7%
MALE POVERTY
0.4/ 100
METRIC RATING
239th/ 347
METRIC RANK
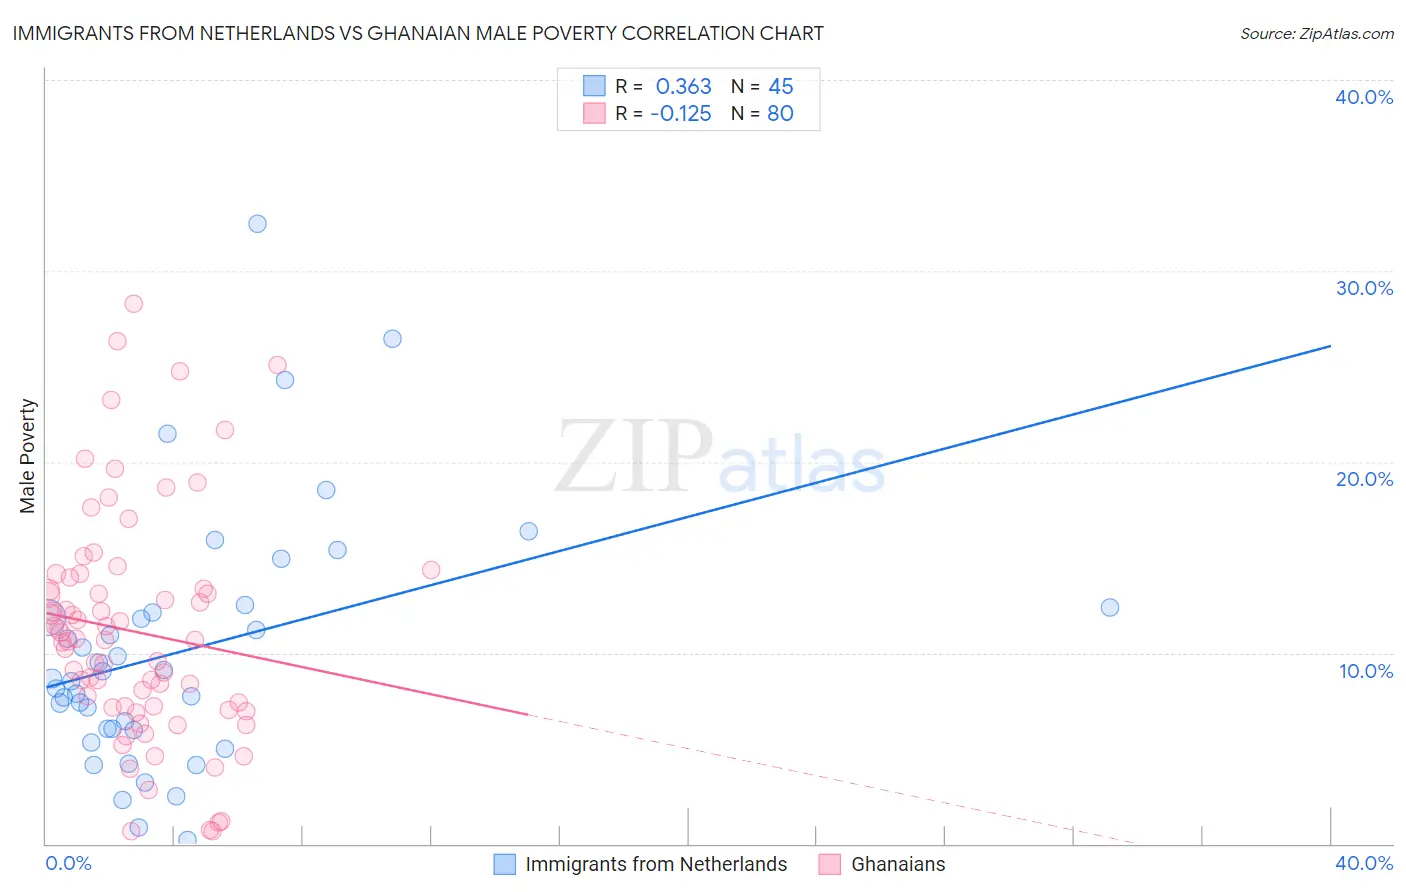
Immigrants from Netherlands vs Ghanaian Male Poverty Correlation Chart
The statistical analysis conducted on geographies consisting of 237,754,800 people shows a mild positive correlation between the proportion of Immigrants from Netherlands and poverty level among males in the United States with a correlation coefficient (R) of 0.363 and weighted average of 10.2%. Similarly, the statistical analysis conducted on geographies consisting of 190,493,527 people shows a poor negative correlation between the proportion of Ghanaians and poverty level among males in the United States with a correlation coefficient (R) of -0.125 and weighted average of 12.7%, a difference of 24.3%.
Male Poverty Correlation Summary
| Measurement | Immigrants from Netherlands | Ghanaian |
| Minimum | 0.21% | 0.62% |
| Maximum | 32.5% | 28.3% |
| Range | 32.3% | 27.6% |
| Mean | 10.1% | 11.1% |
| Median | 8.7% | 10.7% |
| Interquartile 25% (IQ1) | 6.0% | 7.2% |
| Interquartile 75% (IQ3) | 12.3% | 13.6% |
| Interquartile Range (IQR) | 6.3% | 6.5% |
| Standard Deviation (Sample) | 6.6% | 6.0% |
| Standard Deviation (Population) | 6.6% | 5.9% |
Similar Demographics by Male Poverty
Demographics Similar to Immigrants from Netherlands by Male Poverty
In terms of male poverty, the demographic groups most similar to Immigrants from Netherlands are Immigrants from Sri Lanka (10.2%, a difference of 0.050%), Serbian (10.2%, a difference of 0.17%), Zimbabwean (10.2%, a difference of 0.18%), Immigrants from Australia (10.2%, a difference of 0.18%), and Paraguayan (10.2%, a difference of 0.20%).
| Demographics | Rating | Rank | Male Poverty |
| Ukrainians | 97.9 /100 | #60 | Exceptional 10.1% |
| Austrians | 97.8 /100 | #61 | Exceptional 10.1% |
| Immigrants | Italy | 97.8 /100 | #62 | Exceptional 10.2% |
| Slovaks | 97.7 /100 | #63 | Exceptional 10.2% |
| Swiss | 97.5 /100 | #64 | Exceptional 10.2% |
| Zimbabweans | 97.5 /100 | #65 | Exceptional 10.2% |
| Serbians | 97.5 /100 | #66 | Exceptional 10.2% |
| Immigrants | Netherlands | 97.3 /100 | #67 | Exceptional 10.2% |
| Immigrants | Sri Lanka | 97.2 /100 | #68 | Exceptional 10.2% |
| Immigrants | Australia | 97.1 /100 | #69 | Exceptional 10.2% |
| Paraguayans | 97.1 /100 | #70 | Exceptional 10.2% |
| Europeans | 97.1 /100 | #71 | Exceptional 10.2% |
| Immigrants | Canada | 97.1 /100 | #72 | Exceptional 10.2% |
| Immigrants | Asia | 97.0 /100 | #73 | Exceptional 10.2% |
| Immigrants | Eastern Europe | 96.9 /100 | #74 | Exceptional 10.2% |
Demographics Similar to Ghanaians by Male Poverty
In terms of male poverty, the demographic groups most similar to Ghanaians are Ecuadorian (12.7%, a difference of 0.0%), French American Indian (12.7%, a difference of 0.030%), Immigrants from Saudi Arabia (12.7%, a difference of 0.080%), Immigrants from Middle Africa (12.7%, a difference of 0.27%), and Immigrants from Laos (12.6%, a difference of 0.33%).
| Demographics | Rating | Rank | Male Poverty |
| Nicaraguans | 0.6 /100 | #232 | Tragic 12.6% |
| Fijians | 0.6 /100 | #233 | Tragic 12.6% |
| Immigrants | Armenia | 0.6 /100 | #234 | Tragic 12.6% |
| Immigrants | Laos | 0.5 /100 | #235 | Tragic 12.6% |
| Immigrants | Saudi Arabia | 0.4 /100 | #236 | Tragic 12.7% |
| French American Indians | 0.4 /100 | #237 | Tragic 12.7% |
| Ecuadorians | 0.4 /100 | #238 | Tragic 12.7% |
| Ghanaians | 0.4 /100 | #239 | Tragic 12.7% |
| Immigrants | Middle Africa | 0.4 /100 | #240 | Tragic 12.7% |
| Sudanese | 0.3 /100 | #241 | Tragic 12.8% |
| Nepalese | 0.3 /100 | #242 | Tragic 12.8% |
| Alaskan Athabascans | 0.3 /100 | #243 | Tragic 12.8% |
| Tsimshian | 0.3 /100 | #244 | Tragic 12.8% |
| Liberians | 0.3 /100 | #245 | Tragic 12.8% |
| Immigrants | El Salvador | 0.2 /100 | #246 | Tragic 12.8% |