Immigrants from Dominican Republic vs Swedish Male Poverty
COMPARE
Immigrants from Dominican Republic
Swedish
Male Poverty
Male Poverty Comparison
Immigrants from Dominican Republic
Swedes
16.2%
MALE POVERTY
0.0/ 100
METRIC RATING
330th/ 347
METRIC RANK
9.6%
MALE POVERTY
99.7/ 100
METRIC RATING
24th/ 347
METRIC RANK
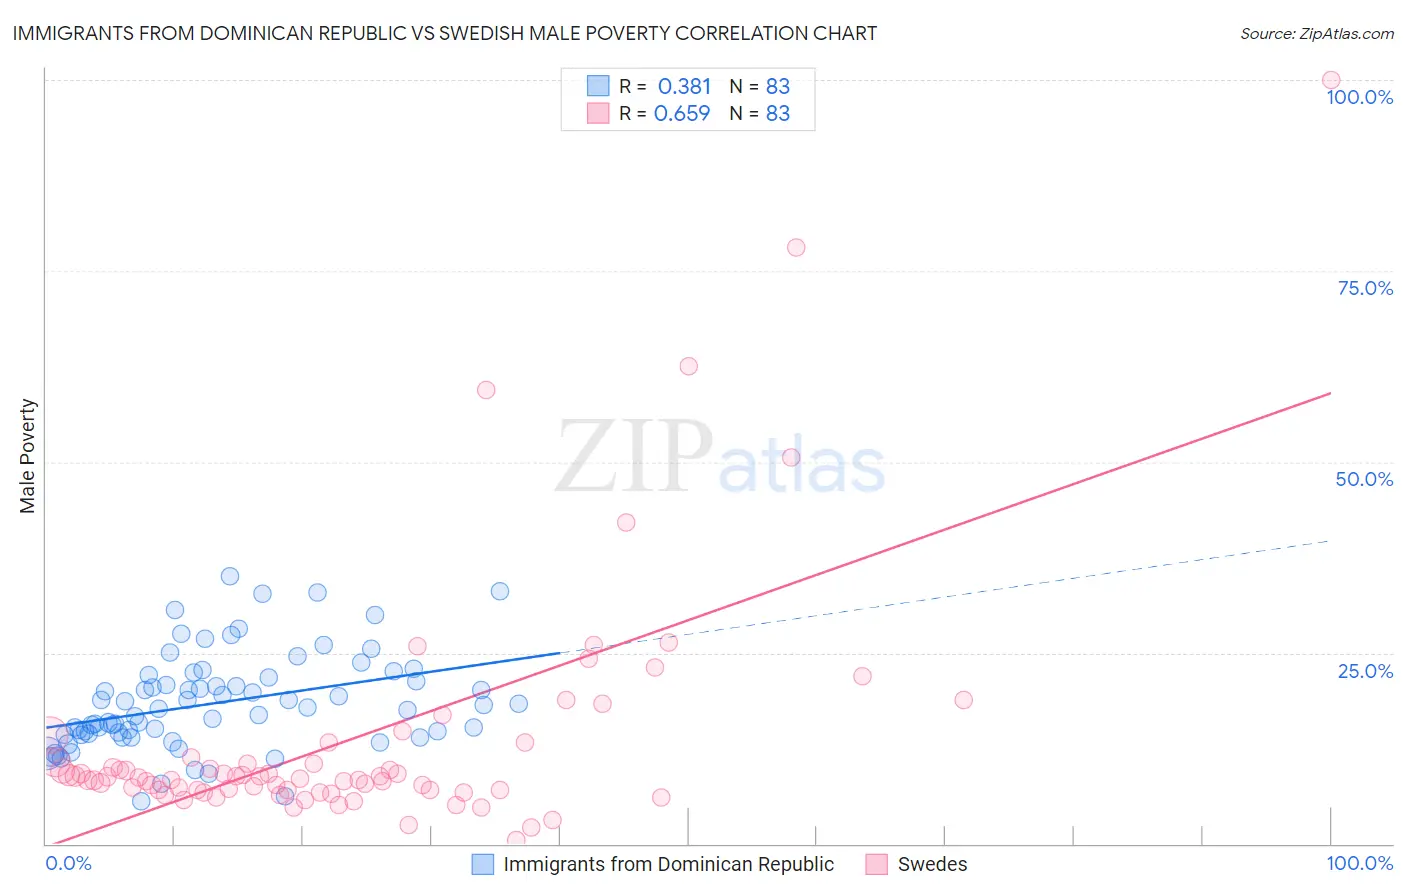
Immigrants from Dominican Republic vs Swedish Male Poverty Correlation Chart
The statistical analysis conducted on geographies consisting of 274,910,584 people shows a mild positive correlation between the proportion of Immigrants from Dominican Republic and poverty level among males in the United States with a correlation coefficient (R) of 0.381 and weighted average of 16.2%. Similarly, the statistical analysis conducted on geographies consisting of 538,008,774 people shows a significant positive correlation between the proportion of Swedes and poverty level among males in the United States with a correlation coefficient (R) of 0.659 and weighted average of 9.6%, a difference of 68.1%.
Male Poverty Correlation Summary
| Measurement | Immigrants from Dominican Republic | Swedish |
| Minimum | 5.5% | 0.53% |
| Maximum | 35.1% | 100.0% |
| Range | 29.5% | 99.5% |
| Mean | 18.4% | 13.8% |
| Median | 17.7% | 8.6% |
| Interquartile 25% (IQ1) | 14.2% | 7.0% |
| Interquartile 75% (IQ3) | 21.7% | 11.3% |
| Interquartile Range (IQR) | 7.5% | 4.3% |
| Standard Deviation (Sample) | 6.2% | 16.3% |
| Standard Deviation (Population) | 6.2% | 16.2% |
Similar Demographics by Male Poverty
Demographics Similar to Immigrants from Dominican Republic by Male Poverty
In terms of male poverty, the demographic groups most similar to Immigrants from Dominican Republic are Ute (16.2%, a difference of 0.34%), Dominican (16.1%, a difference of 0.65%), Black/African American (15.8%, a difference of 2.4%), Paiute (15.8%, a difference of 2.4%), and Houma (16.7%, a difference of 3.3%).
| Demographics | Rating | Rank | Male Poverty |
| Colville | 0.0 /100 | #323 | Tragic 15.2% |
| Menominee | 0.0 /100 | #324 | Tragic 15.3% |
| Yakama | 0.0 /100 | #325 | Tragic 15.3% |
| Central American Indians | 0.0 /100 | #326 | Tragic 15.3% |
| Paiute | 0.0 /100 | #327 | Tragic 15.8% |
| Blacks/African Americans | 0.0 /100 | #328 | Tragic 15.8% |
| Dominicans | 0.0 /100 | #329 | Tragic 16.1% |
| Immigrants | Dominican Republic | 0.0 /100 | #330 | Tragic 16.2% |
| Ute | 0.0 /100 | #331 | Tragic 16.2% |
| Houma | 0.0 /100 | #332 | Tragic 16.7% |
| Natives/Alaskans | 0.0 /100 | #333 | Tragic 16.9% |
| Cheyenne | 0.0 /100 | #334 | Tragic 17.6% |
| Apache | 0.0 /100 | #335 | Tragic 17.7% |
| Pueblo | 0.0 /100 | #336 | Tragic 18.5% |
| Sioux | 0.0 /100 | #337 | Tragic 18.7% |
Demographics Similar to Swedes by Male Poverty
In terms of male poverty, the demographic groups most similar to Swedes are Italian (9.6%, a difference of 0.080%), Croatian (9.6%, a difference of 0.090%), Eastern European (9.6%, a difference of 0.14%), Immigrants from Scotland (9.6%, a difference of 0.34%), and Burmese (9.7%, a difference of 0.58%).
| Demographics | Rating | Rank | Male Poverty |
| Norwegians | 99.8 /100 | #17 | Exceptional 9.5% |
| Lithuanians | 99.8 /100 | #18 | Exceptional 9.5% |
| Immigrants | Hong Kong | 99.7 /100 | #19 | Exceptional 9.6% |
| Latvians | 99.7 /100 | #20 | Exceptional 9.6% |
| Immigrants | Scotland | 99.7 /100 | #21 | Exceptional 9.6% |
| Croatians | 99.7 /100 | #22 | Exceptional 9.6% |
| Italians | 99.7 /100 | #23 | Exceptional 9.6% |
| Swedes | 99.7 /100 | #24 | Exceptional 9.6% |
| Eastern Europeans | 99.6 /100 | #25 | Exceptional 9.6% |
| Burmese | 99.6 /100 | #26 | Exceptional 9.7% |
| Danes | 99.6 /100 | #27 | Exceptional 9.7% |
| Immigrants | Korea | 99.6 /100 | #28 | Exceptional 9.7% |
| Greeks | 99.6 /100 | #29 | Exceptional 9.7% |
| Poles | 99.5 /100 | #30 | Exceptional 9.7% |
| Tongans | 99.5 /100 | #31 | Exceptional 9.7% |