Immigrants from Dominican Republic vs Immigrants from Latin America Male Poverty
COMPARE
Immigrants from Dominican Republic
Immigrants from Latin America
Male Poverty
Male Poverty Comparison
Immigrants from Dominican Republic
Immigrants from Latin America
16.2%
MALE POVERTY
0.0/ 100
METRIC RATING
330th/ 347
METRIC RANK
13.6%
MALE POVERTY
0.0/ 100
METRIC RATING
276th/ 347
METRIC RANK
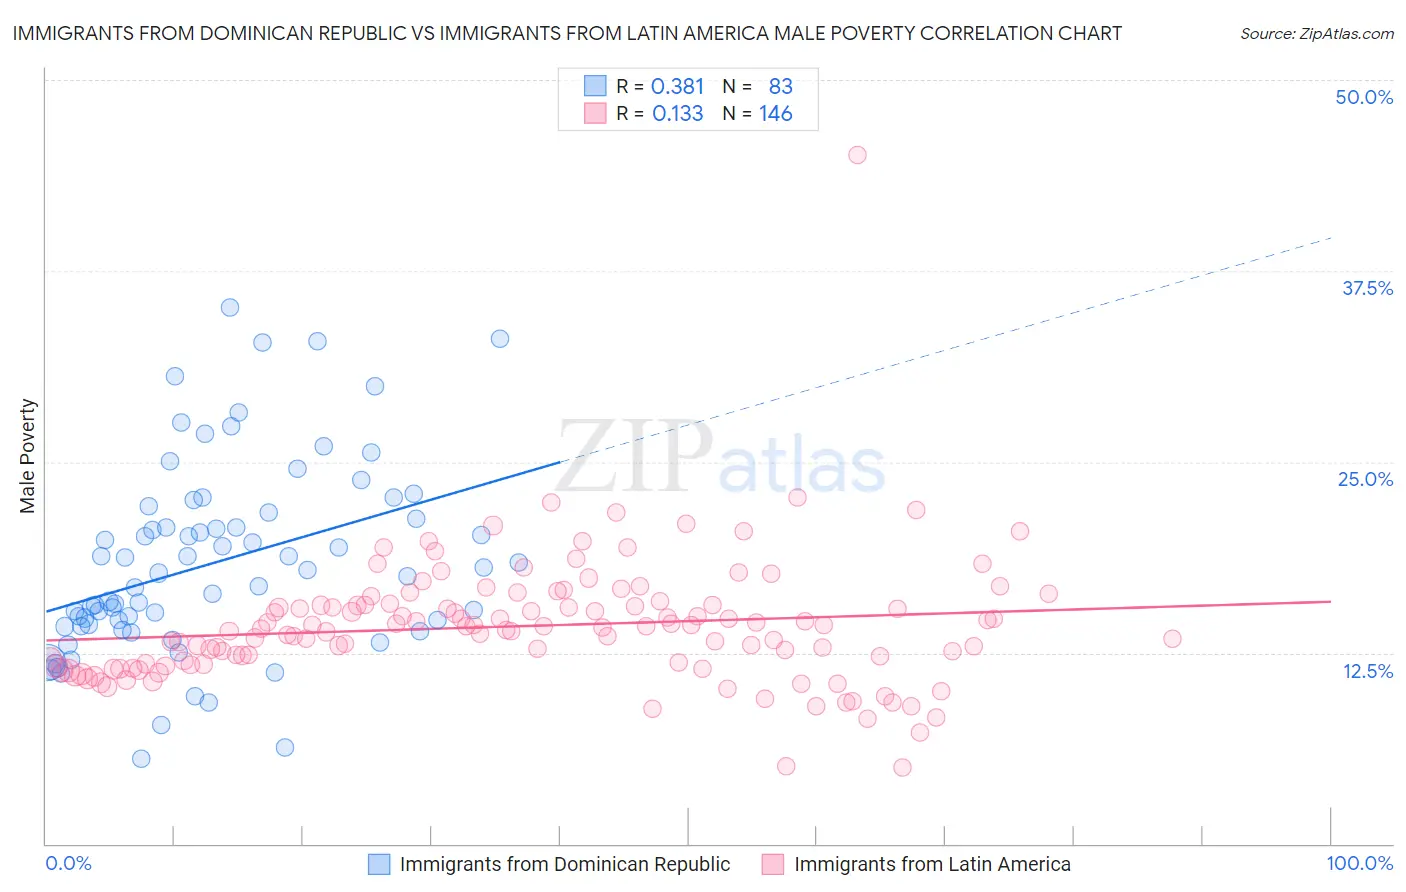
Immigrants from Dominican Republic vs Immigrants from Latin America Male Poverty Correlation Chart
The statistical analysis conducted on geographies consisting of 274,910,584 people shows a mild positive correlation between the proportion of Immigrants from Dominican Republic and poverty level among males in the United States with a correlation coefficient (R) of 0.381 and weighted average of 16.2%. Similarly, the statistical analysis conducted on geographies consisting of 557,334,914 people shows a poor positive correlation between the proportion of Immigrants from Latin America and poverty level among males in the United States with a correlation coefficient (R) of 0.133 and weighted average of 13.6%, a difference of 18.9%.
Male Poverty Correlation Summary
| Measurement | Immigrants from Dominican Republic | Immigrants from Latin America |
| Minimum | 5.5% | 5.0% |
| Maximum | 35.1% | 45.1% |
| Range | 29.5% | 40.1% |
| Mean | 18.4% | 14.2% |
| Median | 17.7% | 14.1% |
| Interquartile 25% (IQ1) | 14.2% | 11.8% |
| Interquartile 75% (IQ3) | 21.7% | 15.6% |
| Interquartile Range (IQR) | 7.5% | 3.9% |
| Standard Deviation (Sample) | 6.2% | 4.2% |
| Standard Deviation (Population) | 6.2% | 4.2% |
Similar Demographics by Male Poverty
Demographics Similar to Immigrants from Dominican Republic by Male Poverty
In terms of male poverty, the demographic groups most similar to Immigrants from Dominican Republic are Ute (16.2%, a difference of 0.34%), Dominican (16.1%, a difference of 0.65%), Black/African American (15.8%, a difference of 2.4%), Paiute (15.8%, a difference of 2.4%), and Houma (16.7%, a difference of 3.3%).
| Demographics | Rating | Rank | Male Poverty |
| Colville | 0.0 /100 | #323 | Tragic 15.2% |
| Menominee | 0.0 /100 | #324 | Tragic 15.3% |
| Yakama | 0.0 /100 | #325 | Tragic 15.3% |
| Central American Indians | 0.0 /100 | #326 | Tragic 15.3% |
| Paiute | 0.0 /100 | #327 | Tragic 15.8% |
| Blacks/African Americans | 0.0 /100 | #328 | Tragic 15.8% |
| Dominicans | 0.0 /100 | #329 | Tragic 16.1% |
| Immigrants | Dominican Republic | 0.0 /100 | #330 | Tragic 16.2% |
| Ute | 0.0 /100 | #331 | Tragic 16.2% |
| Houma | 0.0 /100 | #332 | Tragic 16.7% |
| Natives/Alaskans | 0.0 /100 | #333 | Tragic 16.9% |
| Cheyenne | 0.0 /100 | #334 | Tragic 17.6% |
| Apache | 0.0 /100 | #335 | Tragic 17.7% |
| Pueblo | 0.0 /100 | #336 | Tragic 18.5% |
| Sioux | 0.0 /100 | #337 | Tragic 18.7% |
Demographics Similar to Immigrants from Latin America by Male Poverty
In terms of male poverty, the demographic groups most similar to Immigrants from Latin America are Bangladeshi (13.6%, a difference of 0.15%), Barbadian (13.6%, a difference of 0.19%), Belizean (13.6%, a difference of 0.24%), Haitian (13.7%, a difference of 0.42%), and Mexican (13.7%, a difference of 0.52%).
| Demographics | Rating | Rank | Male Poverty |
| Guyanese | 0.0 /100 | #269 | Tragic 13.3% |
| Cree | 0.0 /100 | #270 | Tragic 13.3% |
| Spanish Americans | 0.0 /100 | #271 | Tragic 13.4% |
| Immigrants | Bahamas | 0.0 /100 | #272 | Tragic 13.5% |
| Chickasaw | 0.0 /100 | #273 | Tragic 13.5% |
| Immigrants | West Indies | 0.0 /100 | #274 | Tragic 13.5% |
| Barbadians | 0.0 /100 | #275 | Tragic 13.6% |
| Immigrants | Latin America | 0.0 /100 | #276 | Tragic 13.6% |
| Bangladeshis | 0.0 /100 | #277 | Tragic 13.6% |
| Belizeans | 0.0 /100 | #278 | Tragic 13.6% |
| Haitians | 0.0 /100 | #279 | Tragic 13.7% |
| Mexicans | 0.0 /100 | #280 | Tragic 13.7% |
| Yaqui | 0.0 /100 | #281 | Tragic 13.7% |
| Immigrants | Cabo Verde | 0.0 /100 | #282 | Tragic 13.7% |
| Comanche | 0.0 /100 | #283 | Tragic 13.8% |