Immigrants from Dominica vs Immigrants from Russia Poverty
COMPARE
Immigrants from Dominica
Immigrants from Russia
Poverty
Poverty Comparison
Immigrants from Dominica
Immigrants from Russia
16.1%
POVERTY
0.0/ 100
METRIC RATING
318th/ 347
METRIC RANK
11.7%
POVERTY
89.7/ 100
METRIC RATING
116th/ 347
METRIC RANK
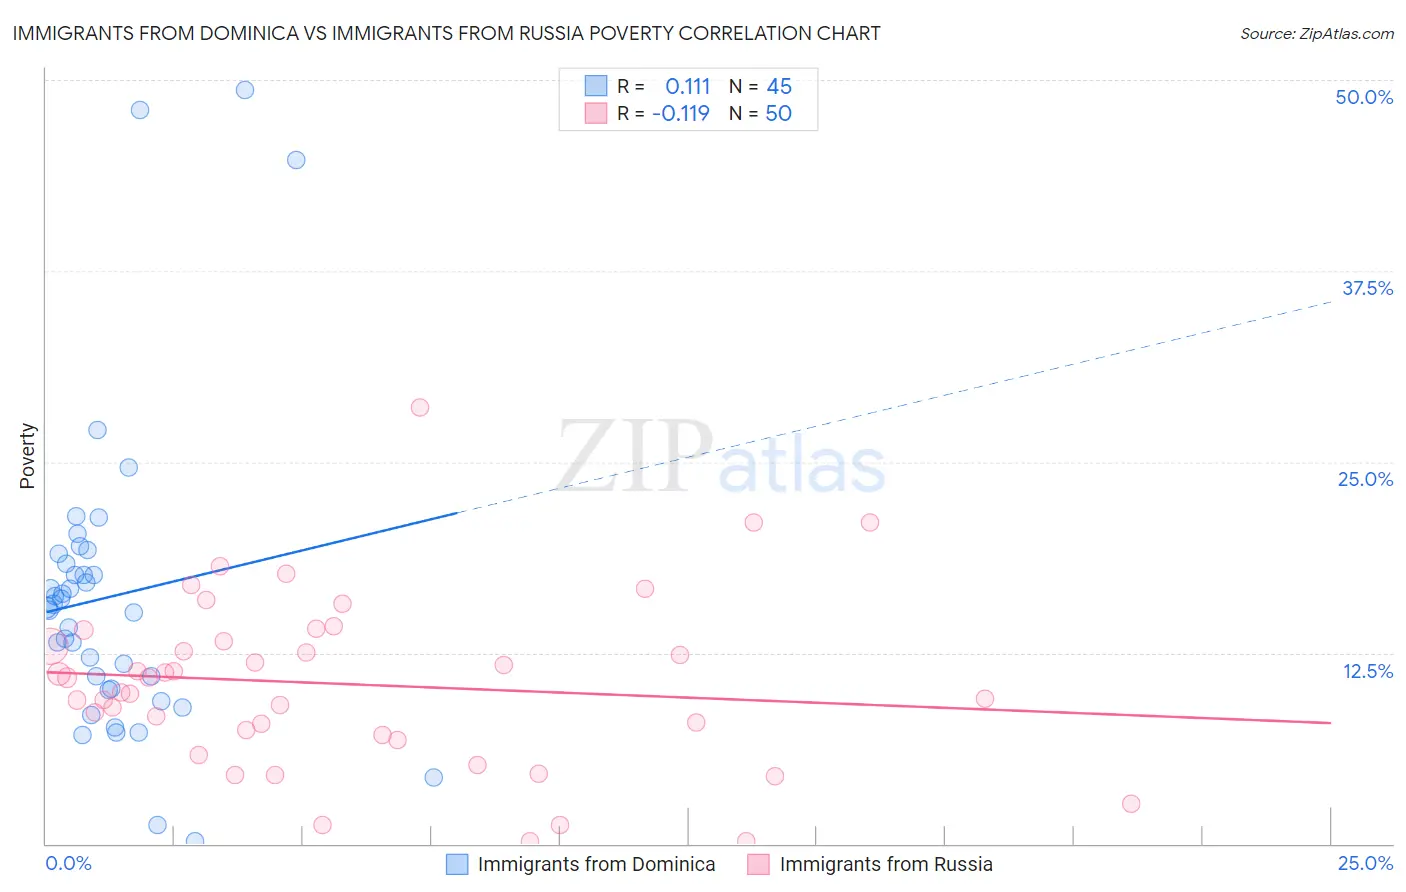
Immigrants from Dominica vs Immigrants from Russia Poverty Correlation Chart
The statistical analysis conducted on geographies consisting of 83,789,226 people shows a poor positive correlation between the proportion of Immigrants from Dominica and poverty level in the United States with a correlation coefficient (R) of 0.111 and weighted average of 16.1%. Similarly, the statistical analysis conducted on geographies consisting of 347,709,239 people shows a poor negative correlation between the proportion of Immigrants from Russia and poverty level in the United States with a correlation coefficient (R) of -0.119 and weighted average of 11.7%, a difference of 37.9%.
Poverty Correlation Summary
| Measurement | Immigrants from Dominica | Immigrants from Russia |
| Minimum | 0.13% | 0.17% |
| Maximum | 49.3% | 28.6% |
| Range | 49.2% | 28.4% |
| Mean | 16.2% | 10.4% |
| Median | 15.5% | 10.4% |
| Interquartile 25% (IQ1) | 10.1% | 7.1% |
| Interquartile 75% (IQ3) | 18.7% | 13.3% |
| Interquartile Range (IQR) | 8.6% | 6.2% |
| Standard Deviation (Sample) | 10.1% | 5.7% |
| Standard Deviation (Population) | 10.0% | 5.6% |
Similar Demographics by Poverty
Demographics Similar to Immigrants from Dominica by Poverty
In terms of poverty, the demographic groups most similar to Immigrants from Dominica are Immigrants from Congo (16.1%, a difference of 0.20%), U.S. Virgin Islander (16.1%, a difference of 0.29%), Immigrants from Honduras (16.2%, a difference of 0.43%), Arapaho (16.3%, a difference of 1.2%), and British West Indian (15.9%, a difference of 1.5%).
| Demographics | Rating | Rank | Poverty |
| Chippewa | 0.0 /100 | #311 | Tragic 15.7% |
| Cajuns | 0.0 /100 | #312 | Tragic 15.7% |
| Immigrants | Grenada | 0.0 /100 | #313 | Tragic 15.8% |
| Immigrants | Somalia | 0.0 /100 | #314 | Tragic 15.8% |
| British West Indians | 0.0 /100 | #315 | Tragic 15.9% |
| Hondurans | 0.0 /100 | #316 | Tragic 15.9% |
| U.S. Virgin Islanders | 0.0 /100 | #317 | Tragic 16.1% |
| Immigrants | Dominica | 0.0 /100 | #318 | Tragic 16.1% |
| Immigrants | Congo | 0.0 /100 | #319 | Tragic 16.1% |
| Immigrants | Honduras | 0.0 /100 | #320 | Tragic 16.2% |
| Arapaho | 0.0 /100 | #321 | Tragic 16.3% |
| Menominee | 0.0 /100 | #322 | Tragic 16.4% |
| Colville | 0.0 /100 | #323 | Tragic 16.6% |
| Yakama | 0.0 /100 | #324 | Tragic 16.7% |
| Central American Indians | 0.0 /100 | #325 | Tragic 16.7% |
Demographics Similar to Immigrants from Russia by Poverty
In terms of poverty, the demographic groups most similar to Immigrants from Russia are Sri Lankan (11.7%, a difference of 0.070%), Argentinean (11.7%, a difference of 0.15%), Albanian (11.7%, a difference of 0.17%), Tlingit-Haida (11.7%, a difference of 0.19%), and Immigrants from South Eastern Asia (11.7%, a difference of 0.20%).
| Demographics | Rating | Rank | Poverty |
| Immigrants | Turkey | 91.7 /100 | #109 | Exceptional 11.6% |
| Welsh | 91.6 /100 | #110 | Exceptional 11.6% |
| French Canadians | 91.0 /100 | #111 | Exceptional 11.6% |
| Immigrants | Southern Europe | 90.8 /100 | #112 | Exceptional 11.6% |
| Immigrants | Belarus | 90.8 /100 | #113 | Exceptional 11.6% |
| Immigrants | China | 90.7 /100 | #114 | Exceptional 11.6% |
| Albanians | 90.3 /100 | #115 | Exceptional 11.7% |
| Immigrants | Russia | 89.7 /100 | #116 | Excellent 11.7% |
| Sri Lankans | 89.4 /100 | #117 | Excellent 11.7% |
| Argentineans | 89.1 /100 | #118 | Excellent 11.7% |
| Tlingit-Haida | 89.0 /100 | #119 | Excellent 11.7% |
| Immigrants | South Eastern Asia | 88.9 /100 | #120 | Excellent 11.7% |
| New Zealanders | 88.7 /100 | #121 | Excellent 11.7% |
| Puget Sound Salish | 88.7 /100 | #122 | Excellent 11.7% |
| Immigrants | Hungary | 88.6 /100 | #123 | Excellent 11.7% |