Immigrants from Dominica vs Crow 10th Grade
COMPARE
Immigrants from Dominica
Crow
10th Grade
10th Grade Comparison
Immigrants from Dominica
Crow
91.1%
10TH GRADE
0.0/ 100
METRIC RATING
305th/ 347
METRIC RANK
94.7%
10TH GRADE
99.0/ 100
METRIC RATING
85th/ 347
METRIC RANK
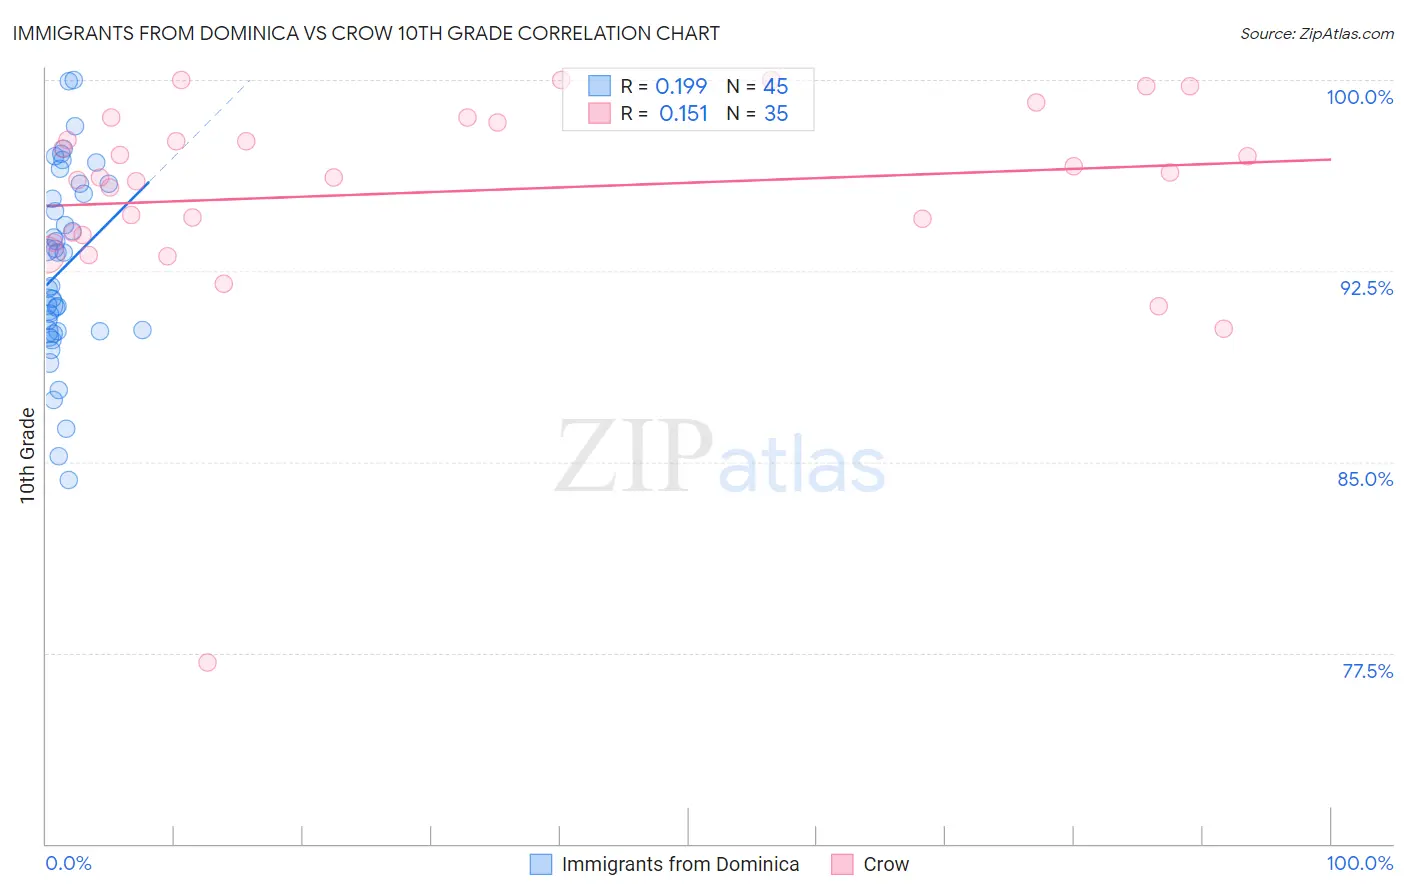
Immigrants from Dominica vs Crow 10th Grade Correlation Chart
The statistical analysis conducted on geographies consisting of 83,794,115 people shows a poor positive correlation between the proportion of Immigrants from Dominica and percentage of population with at least 10th grade education in the United States with a correlation coefficient (R) of 0.199 and weighted average of 91.1%. Similarly, the statistical analysis conducted on geographies consisting of 59,209,940 people shows a poor positive correlation between the proportion of Crow and percentage of population with at least 10th grade education in the United States with a correlation coefficient (R) of 0.151 and weighted average of 94.7%, a difference of 3.9%.
10th Grade Correlation Summary
| Measurement | Immigrants from Dominica | Crow |
| Minimum | 84.3% | 77.1% |
| Maximum | 100.0% | 100.0% |
| Range | 15.7% | 22.9% |
| Mean | 92.6% | 95.6% |
| Median | 91.9% | 96.2% |
| Interquartile 25% (IQ1) | 90.1% | 93.9% |
| Interquartile 75% (IQ3) | 95.7% | 98.3% |
| Interquartile Range (IQR) | 5.6% | 4.4% |
| Standard Deviation (Sample) | 3.7% | 4.1% |
| Standard Deviation (Population) | 3.7% | 4.1% |
Similar Demographics by 10th Grade
Demographics Similar to Immigrants from Dominica by 10th Grade
In terms of 10th grade, the demographic groups most similar to Immigrants from Dominica are Pima (91.2%, a difference of 0.020%), Yaqui (91.1%, a difference of 0.060%), Immigrants from Vietnam (91.2%, a difference of 0.070%), Immigrants from Guyana (91.2%, a difference of 0.090%), and Japanese (91.2%, a difference of 0.10%).
| Demographics | Rating | Rank | 10th Grade |
| Cubans | 0.0 /100 | #298 | Tragic 91.5% |
| Immigrants | Haiti | 0.0 /100 | #299 | Tragic 91.4% |
| Guyanese | 0.0 /100 | #300 | Tragic 91.4% |
| Japanese | 0.0 /100 | #301 | Tragic 91.2% |
| Immigrants | Guyana | 0.0 /100 | #302 | Tragic 91.2% |
| Immigrants | Vietnam | 0.0 /100 | #303 | Tragic 91.2% |
| Pima | 0.0 /100 | #304 | Tragic 91.2% |
| Immigrants | Dominica | 0.0 /100 | #305 | Tragic 91.1% |
| Yaqui | 0.0 /100 | #306 | Tragic 91.1% |
| Immigrants | Fiji | 0.0 /100 | #307 | Tragic 91.0% |
| Immigrants | Bangladesh | 0.0 /100 | #308 | Tragic 91.0% |
| Immigrants | Immigrants | 0.0 /100 | #309 | Tragic 91.0% |
| Vietnamese | 0.0 /100 | #310 | Tragic 90.9% |
| Immigrants | Cambodia | 0.0 /100 | #311 | Tragic 90.9% |
| Immigrants | Portugal | 0.0 /100 | #312 | Tragic 90.8% |
Demographics Similar to Crow by 10th Grade
In terms of 10th grade, the demographic groups most similar to Crow are Puget Sound Salish (94.7%, a difference of 0.0%), Immigrants from Western Europe (94.7%, a difference of 0.010%), Icelander (94.7%, a difference of 0.010%), Immigrants from Saudi Arabia (94.7%, a difference of 0.010%), and Immigrants from Japan (94.7%, a difference of 0.010%).
| Demographics | Rating | Rank | 10th Grade |
| Filipinos | 99.3 /100 | #78 | Exceptional 94.8% |
| Immigrants | Czechoslovakia | 99.2 /100 | #79 | Exceptional 94.7% |
| Immigrants | Denmark | 99.2 /100 | #80 | Exceptional 94.7% |
| Immigrants | Latvia | 99.2 /100 | #81 | Exceptional 94.7% |
| Swiss | 99.1 /100 | #82 | Exceptional 94.7% |
| Immigrants | Western Europe | 99.1 /100 | #83 | Exceptional 94.7% |
| Icelanders | 99.1 /100 | #84 | Exceptional 94.7% |
| Crow | 99.0 /100 | #85 | Exceptional 94.7% |
| Puget Sound Salish | 99.0 /100 | #86 | Exceptional 94.7% |
| Immigrants | Saudi Arabia | 99.0 /100 | #87 | Exceptional 94.7% |
| Immigrants | Japan | 99.0 /100 | #88 | Exceptional 94.7% |
| Immigrants | Moldova | 98.9 /100 | #89 | Exceptional 94.7% |
| South Africans | 98.8 /100 | #90 | Exceptional 94.7% |
| Whites/Caucasians | 98.8 /100 | #91 | Exceptional 94.7% |
| Yugoslavians | 98.4 /100 | #92 | Exceptional 94.6% |