Immigrants from Cuba vs Kenyan Single Female Poverty
COMPARE
Immigrants from Cuba
Kenyan
Single Female Poverty
Single Female Poverty Comparison
Immigrants from Cuba
Kenyans
21.2%
SINGLE FEMALE POVERTY
35.3/ 100
METRIC RATING
189th/ 347
METRIC RANK
20.8%
SINGLE FEMALE POVERTY
68.5/ 100
METRIC RATING
161st/ 347
METRIC RANK
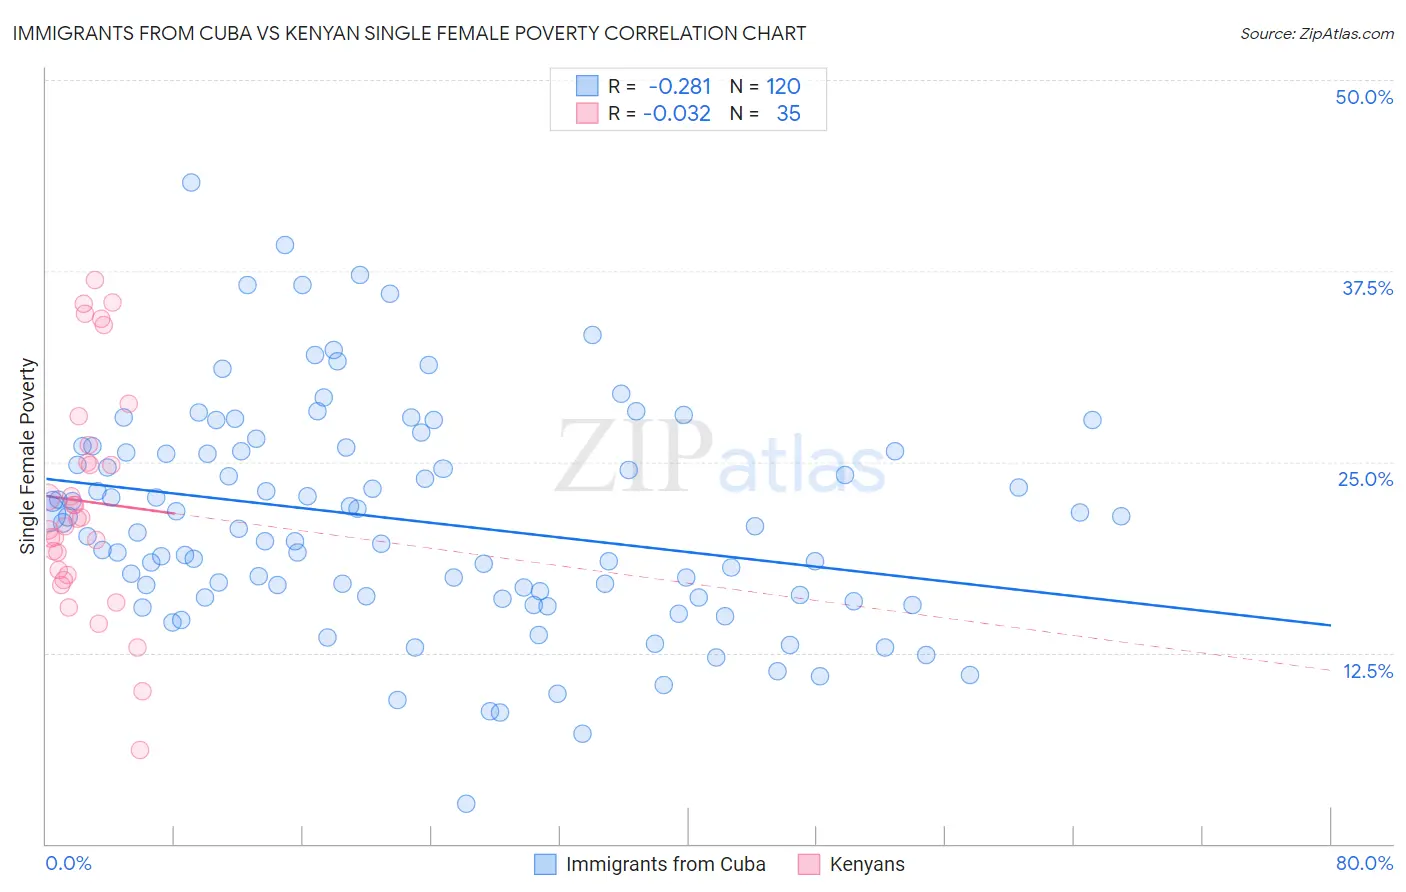
Immigrants from Cuba vs Kenyan Single Female Poverty Correlation Chart
The statistical analysis conducted on geographies consisting of 322,497,975 people shows a weak negative correlation between the proportion of Immigrants from Cuba and poverty level among single females in the United States with a correlation coefficient (R) of -0.281 and weighted average of 21.2%. Similarly, the statistical analysis conducted on geographies consisting of 167,254,696 people shows no correlation between the proportion of Kenyans and poverty level among single females in the United States with a correlation coefficient (R) of -0.032 and weighted average of 20.8%, a difference of 2.2%.
Single Female Poverty Correlation Summary
| Measurement | Immigrants from Cuba | Kenyan |
| Minimum | 2.6% | 6.1% |
| Maximum | 43.3% | 36.9% |
| Range | 40.7% | 30.8% |
| Mean | 21.1% | 22.4% |
| Median | 20.7% | 21.2% |
| Interquartile 25% (IQ1) | 16.2% | 17.6% |
| Interquartile 75% (IQ3) | 25.7% | 26.1% |
| Interquartile Range (IQR) | 9.5% | 8.6% |
| Standard Deviation (Sample) | 7.2% | 7.5% |
| Standard Deviation (Population) | 7.2% | 7.4% |
Similar Demographics by Single Female Poverty
Demographics Similar to Immigrants from Cuba by Single Female Poverty
In terms of single female poverty, the demographic groups most similar to Immigrants from Cuba are Trinidadian and Tobagonian (21.2%, a difference of 0.0%), Yugoslavian (21.2%, a difference of 0.010%), Immigrants from Nigeria (21.2%, a difference of 0.10%), Hawaiian (21.2%, a difference of 0.16%), and Immigrants from Cambodia (21.2%, a difference of 0.20%).
| Demographics | Rating | Rank | Single Female Poverty |
| Slavs | 40.5 /100 | #182 | Average 21.1% |
| Slovaks | 39.7 /100 | #183 | Fair 21.1% |
| Hungarians | 39.6 /100 | #184 | Fair 21.1% |
| Immigrants | Cambodia | 38.2 /100 | #185 | Fair 21.2% |
| Hawaiians | 37.7 /100 | #186 | Fair 21.2% |
| Immigrants | Nigeria | 36.8 /100 | #187 | Fair 21.2% |
| Yugoslavians | 35.4 /100 | #188 | Fair 21.2% |
| Immigrants | Cuba | 35.3 /100 | #189 | Fair 21.2% |
| Trinidadians and Tobagonians | 35.2 /100 | #190 | Fair 21.2% |
| Immigrants | Germany | 31.1 /100 | #191 | Fair 21.3% |
| Immigrants | Jamaica | 30.5 /100 | #192 | Fair 21.3% |
| Basques | 28.1 /100 | #193 | Fair 21.3% |
| Czechoslovakians | 27.7 /100 | #194 | Fair 21.3% |
| Nicaraguans | 27.6 /100 | #195 | Fair 21.3% |
| Immigrants | Saudi Arabia | 27.1 /100 | #196 | Fair 21.3% |
Demographics Similar to Kenyans by Single Female Poverty
In terms of single female poverty, the demographic groups most similar to Kenyans are Northern European (20.8%, a difference of 0.010%), Lebanese (20.8%, a difference of 0.060%), Arab (20.7%, a difference of 0.18%), Costa Rican (20.7%, a difference of 0.25%), and Iraqi (20.8%, a difference of 0.28%).
| Demographics | Rating | Rank | Single Female Poverty |
| Immigrants | Western Europe | 76.7 /100 | #154 | Good 20.6% |
| Samoans | 76.0 /100 | #155 | Good 20.6% |
| South American Indians | 75.7 /100 | #156 | Good 20.6% |
| Immigrants | Oceania | 74.3 /100 | #157 | Good 20.7% |
| Danes | 73.0 /100 | #158 | Good 20.7% |
| Costa Ricans | 71.8 /100 | #159 | Good 20.7% |
| Arabs | 70.8 /100 | #160 | Good 20.7% |
| Kenyans | 68.5 /100 | #161 | Good 20.8% |
| Northern Europeans | 68.4 /100 | #162 | Good 20.8% |
| Lebanese | 67.6 /100 | #163 | Good 20.8% |
| Iraqis | 64.5 /100 | #164 | Good 20.8% |
| Ugandans | 64.0 /100 | #165 | Good 20.8% |
| Norwegians | 63.0 /100 | #166 | Good 20.8% |
| Immigrants | Norway | 63.0 /100 | #167 | Good 20.8% |
| Immigrants | Costa Rica | 61.5 /100 | #168 | Good 20.9% |