Immigrants from Cuba vs Finnish Single Female Poverty
COMPARE
Immigrants from Cuba
Finnish
Single Female Poverty
Single Female Poverty Comparison
Immigrants from Cuba
Finns
21.2%
SINGLE FEMALE POVERTY
35.3/ 100
METRIC RATING
189th/ 347
METRIC RANK
21.5%
SINGLE FEMALE POVERTY
16.2/ 100
METRIC RATING
205th/ 347
METRIC RANK
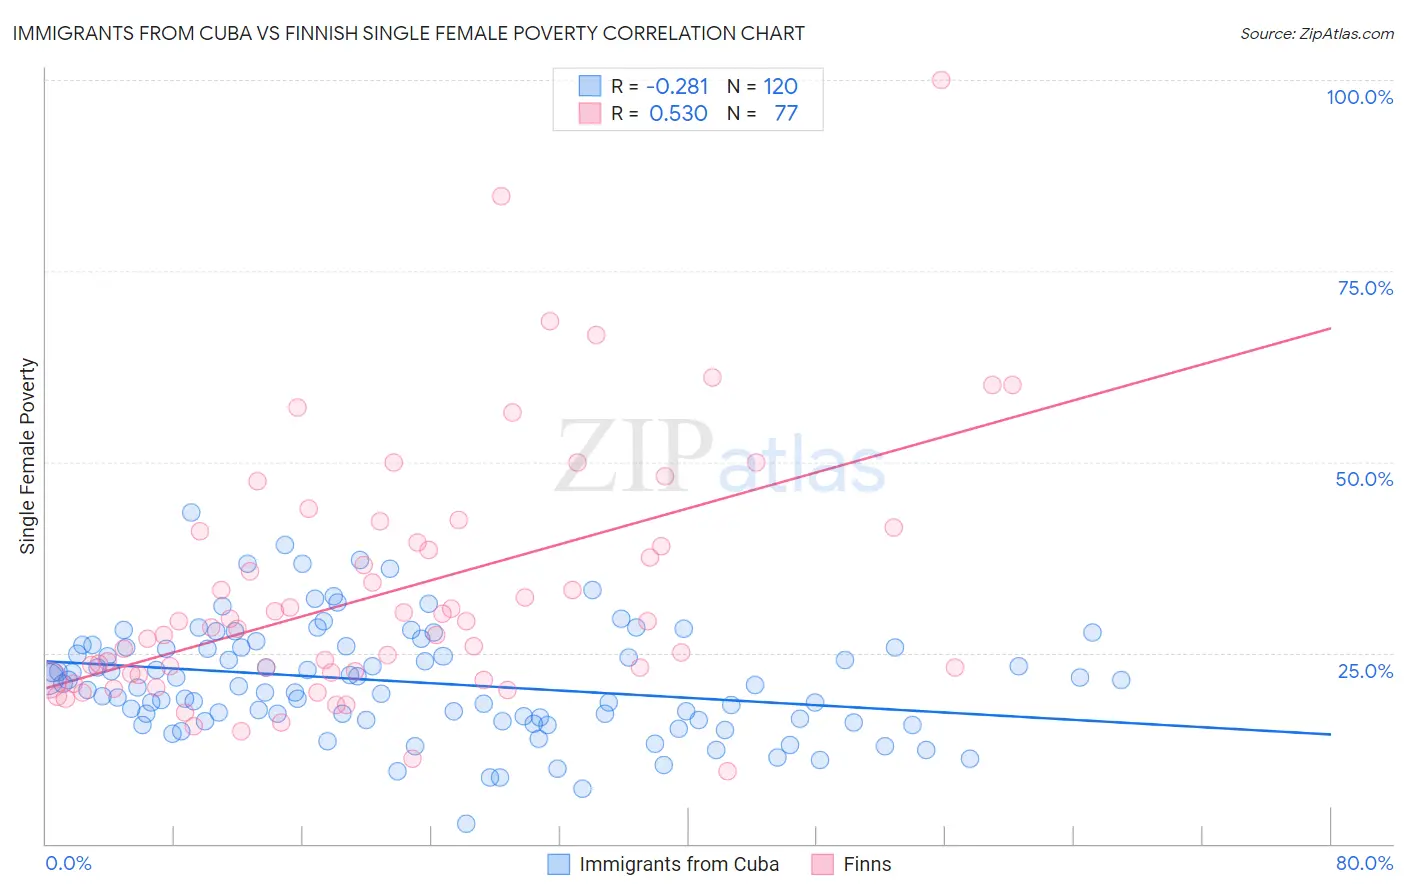
Immigrants from Cuba vs Finnish Single Female Poverty Correlation Chart
The statistical analysis conducted on geographies consisting of 322,497,975 people shows a weak negative correlation between the proportion of Immigrants from Cuba and poverty level among single females in the United States with a correlation coefficient (R) of -0.281 and weighted average of 21.2%. Similarly, the statistical analysis conducted on geographies consisting of 396,433,043 people shows a substantial positive correlation between the proportion of Finns and poverty level among single females in the United States with a correlation coefficient (R) of 0.530 and weighted average of 21.5%, a difference of 1.6%.
Single Female Poverty Correlation Summary
| Measurement | Immigrants from Cuba | Finnish |
| Minimum | 2.6% | 9.5% |
| Maximum | 43.3% | 100.0% |
| Range | 40.7% | 90.5% |
| Mean | 21.1% | 33.0% |
| Median | 20.7% | 28.4% |
| Interquartile 25% (IQ1) | 16.2% | 22.2% |
| Interquartile 75% (IQ3) | 25.7% | 40.2% |
| Interquartile Range (IQR) | 9.5% | 18.0% |
| Standard Deviation (Sample) | 7.2% | 16.5% |
| Standard Deviation (Population) | 7.2% | 16.4% |
Demographics Similar to Immigrants from Cuba and Finns by Single Female Poverty
In terms of single female poverty, the demographic groups most similar to Immigrants from Cuba are Trinidadian and Tobagonian (21.2%, a difference of 0.0%), Yugoslavian (21.2%, a difference of 0.010%), Immigrants from Nigeria (21.2%, a difference of 0.10%), Immigrants from Germany (21.3%, a difference of 0.29%), and Immigrants from Jamaica (21.3%, a difference of 0.33%). Similarly, the demographic groups most similar to Finns are Belgian (21.5%, a difference of 0.020%), Ghanaian (21.6%, a difference of 0.050%), Immigrants from Africa (21.5%, a difference of 0.060%), Immigrants from Haiti (21.5%, a difference of 0.27%), and Immigrants from Kenya (21.4%, a difference of 0.45%).
| Demographics | Rating | Rank | Single Female Poverty |
| Immigrants | Nigeria | 36.8 /100 | #187 | Fair 21.2% |
| Yugoslavians | 35.4 /100 | #188 | Fair 21.2% |
| Immigrants | Cuba | 35.3 /100 | #189 | Fair 21.2% |
| Trinidadians and Tobagonians | 35.2 /100 | #190 | Fair 21.2% |
| Immigrants | Germany | 31.1 /100 | #191 | Fair 21.3% |
| Immigrants | Jamaica | 30.5 /100 | #192 | Fair 21.3% |
| Basques | 28.1 /100 | #193 | Fair 21.3% |
| Czechoslovakians | 27.7 /100 | #194 | Fair 21.3% |
| Nicaraguans | 27.6 /100 | #195 | Fair 21.3% |
| Immigrants | Saudi Arabia | 27.1 /100 | #196 | Fair 21.3% |
| Japanese | 26.4 /100 | #197 | Fair 21.3% |
| Swiss | 24.2 /100 | #198 | Fair 21.4% |
| Immigrants | Immigrants | 22.0 /100 | #199 | Fair 21.4% |
| Irish | 21.4 /100 | #200 | Fair 21.4% |
| Nigerians | 20.9 /100 | #201 | Fair 21.4% |
| Immigrants | Kenya | 20.7 /100 | #202 | Fair 21.4% |
| Immigrants | Haiti | 18.8 /100 | #203 | Poor 21.5% |
| Immigrants | Africa | 16.7 /100 | #204 | Poor 21.5% |
| Finns | 16.2 /100 | #205 | Poor 21.5% |
| Belgians | 16.1 /100 | #206 | Poor 21.5% |
| Ghanaians | 15.7 /100 | #207 | Poor 21.6% |