Spanish American Indian vs Kenyan Single Female Poverty
COMPARE
Spanish American Indian
Kenyan
Single Female Poverty
Single Female Poverty Comparison
Spanish American Indians
Kenyans
21.1%
SINGLE FEMALE POVERTY
42.5/ 100
METRIC RATING
180th/ 347
METRIC RANK
20.8%
SINGLE FEMALE POVERTY
68.5/ 100
METRIC RATING
161st/ 347
METRIC RANK
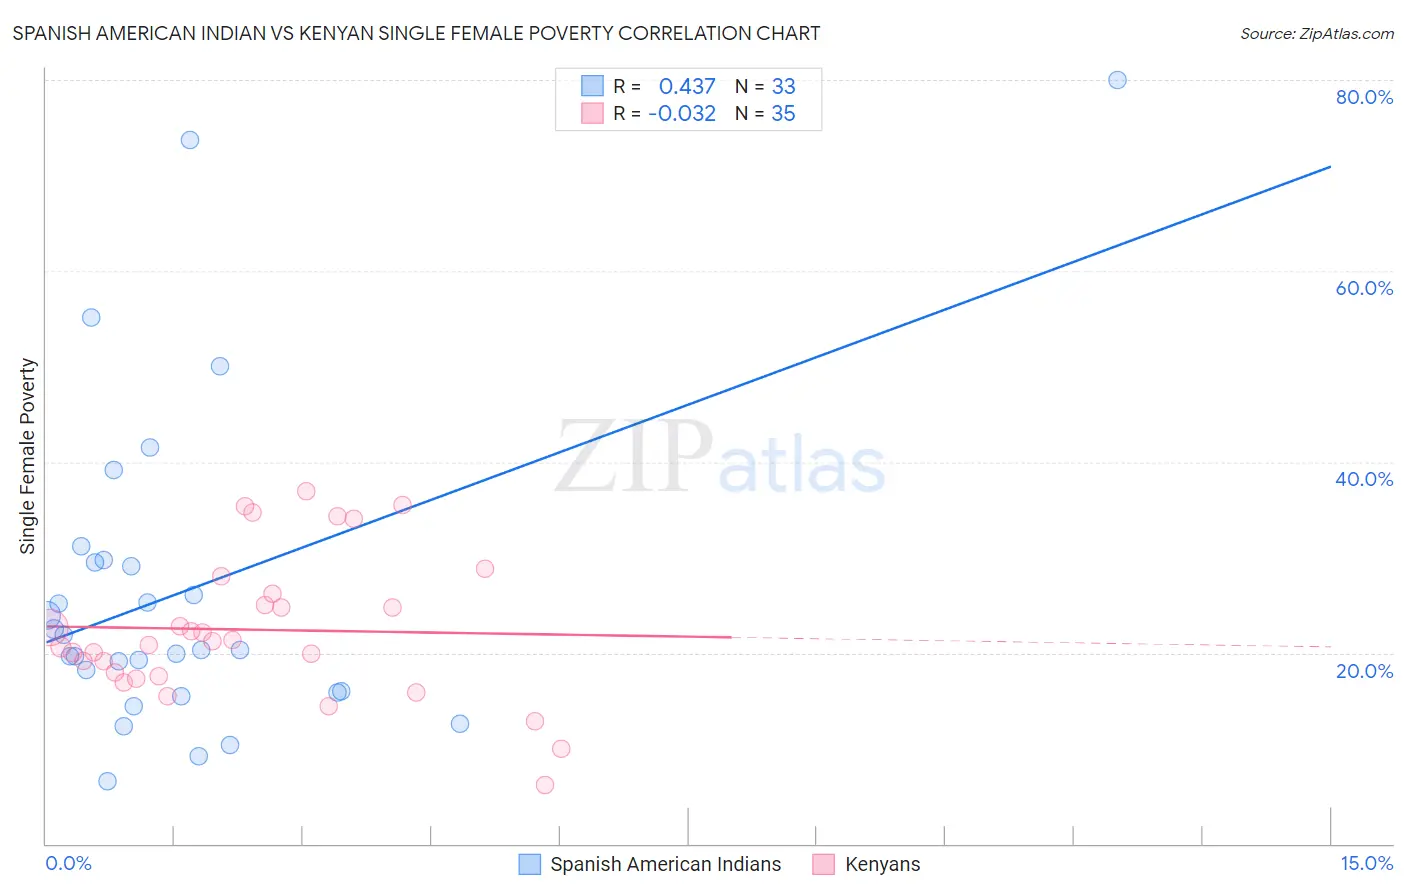
Spanish American Indian vs Kenyan Single Female Poverty Correlation Chart
The statistical analysis conducted on geographies consisting of 73,039,462 people shows a moderate positive correlation between the proportion of Spanish American Indians and poverty level among single females in the United States with a correlation coefficient (R) of 0.437 and weighted average of 21.1%. Similarly, the statistical analysis conducted on geographies consisting of 167,254,696 people shows no correlation between the proportion of Kenyans and poverty level among single females in the United States with a correlation coefficient (R) of -0.032 and weighted average of 20.8%, a difference of 1.7%.
Single Female Poverty Correlation Summary
| Measurement | Spanish American Indian | Kenyan |
| Minimum | 6.5% | 6.1% |
| Maximum | 80.0% | 36.9% |
| Range | 73.5% | 30.8% |
| Mean | 26.4% | 22.4% |
| Median | 20.4% | 21.2% |
| Interquartile 25% (IQ1) | 15.9% | 17.6% |
| Interquartile 75% (IQ3) | 29.6% | 26.1% |
| Interquartile Range (IQR) | 13.6% | 8.6% |
| Standard Deviation (Sample) | 16.9% | 7.5% |
| Standard Deviation (Population) | 16.7% | 7.4% |
Demographics Similar to Spanish American Indians and Kenyans by Single Female Poverty
In terms of single female poverty, the demographic groups most similar to Spanish American Indians are British (21.1%, a difference of 0.030%), Immigrants from Bosnia and Herzegovina (21.1%, a difference of 0.15%), Scandinavian (21.1%, a difference of 0.17%), Canadian (21.1%, a difference of 0.19%), and Czech (21.0%, a difference of 0.27%). Similarly, the demographic groups most similar to Kenyans are Northern European (20.8%, a difference of 0.010%), Lebanese (20.8%, a difference of 0.060%), Arab (20.7%, a difference of 0.18%), Iraqi (20.8%, a difference of 0.28%), and Ugandan (20.8%, a difference of 0.32%).
| Demographics | Rating | Rank | Single Female Poverty |
| Arabs | 70.8 /100 | #160 | Good 20.7% |
| Kenyans | 68.5 /100 | #161 | Good 20.8% |
| Northern Europeans | 68.4 /100 | #162 | Good 20.8% |
| Lebanese | 67.6 /100 | #163 | Good 20.8% |
| Iraqis | 64.5 /100 | #164 | Good 20.8% |
| Ugandans | 64.0 /100 | #165 | Good 20.8% |
| Norwegians | 63.0 /100 | #166 | Good 20.8% |
| Immigrants | Norway | 63.0 /100 | #167 | Good 20.8% |
| Immigrants | Costa Rica | 61.5 /100 | #168 | Good 20.9% |
| Immigrants | Trinidad and Tobago | 56.3 /100 | #169 | Average 20.9% |
| New Zealanders | 53.2 /100 | #170 | Average 21.0% |
| Moroccans | 52.8 /100 | #171 | Average 21.0% |
| Guyanese | 52.0 /100 | #172 | Average 21.0% |
| Immigrants | Guyana | 50.6 /100 | #173 | Average 21.0% |
| Cubans | 50.0 /100 | #174 | Average 21.0% |
| Czechs | 46.8 /100 | #175 | Average 21.0% |
| Canadians | 45.4 /100 | #176 | Average 21.1% |
| Scandinavians | 45.2 /100 | #177 | Average 21.1% |
| Immigrants | Bosnia and Herzegovina | 44.9 /100 | #178 | Average 21.1% |
| British | 42.9 /100 | #179 | Average 21.1% |
| Spanish American Indians | 42.5 /100 | #180 | Average 21.1% |