Immigrants from Hong Kong vs Native Hawaiian Poverty
COMPARE
Immigrants from Hong Kong
Native Hawaiian
Poverty
Poverty Comparison
Immigrants from Hong Kong
Native Hawaiians
10.4%
POVERTY
99.8/ 100
METRIC RATING
13th/ 347
METRIC RANK
11.6%
POVERTY
92.1/ 100
METRIC RATING
104th/ 347
METRIC RANK
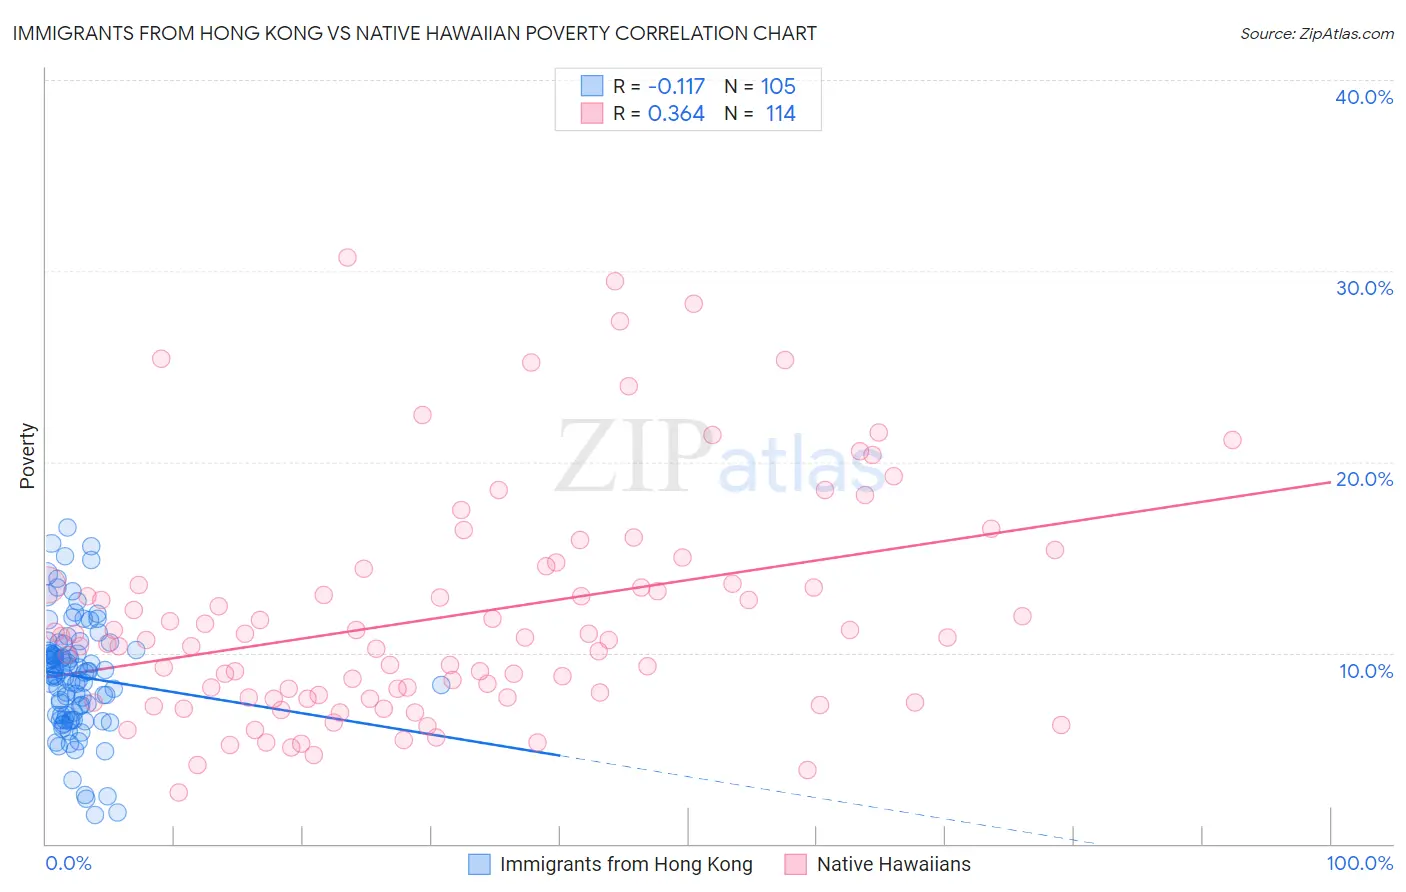
Immigrants from Hong Kong vs Native Hawaiian Poverty Correlation Chart
The statistical analysis conducted on geographies consisting of 253,892,762 people shows a poor negative correlation between the proportion of Immigrants from Hong Kong and poverty level in the United States with a correlation coefficient (R) of -0.117 and weighted average of 10.4%. Similarly, the statistical analysis conducted on geographies consisting of 331,880,799 people shows a mild positive correlation between the proportion of Native Hawaiians and poverty level in the United States with a correlation coefficient (R) of 0.364 and weighted average of 11.6%, a difference of 11.3%.
Poverty Correlation Summary
| Measurement | Immigrants from Hong Kong | Native Hawaiian |
| Minimum | 1.5% | 2.7% |
| Maximum | 16.6% | 30.7% |
| Range | 15.1% | 28.0% |
| Mean | 8.8% | 11.9% |
| Median | 8.9% | 10.7% |
| Interquartile 25% (IQ1) | 6.7% | 7.6% |
| Interquartile 75% (IQ3) | 10.1% | 13.6% |
| Interquartile Range (IQR) | 3.4% | 6.0% |
| Standard Deviation (Sample) | 3.0% | 5.9% |
| Standard Deviation (Population) | 3.0% | 5.9% |
Similar Demographics by Poverty
Demographics Similar to Immigrants from Hong Kong by Poverty
In terms of poverty, the demographic groups most similar to Immigrants from Hong Kong are Bhutanese (10.4%, a difference of 0.22%), Immigrants from Bolivia (10.4%, a difference of 0.31%), Bolivian (10.4%, a difference of 0.32%), Immigrants from Lithuania (10.3%, a difference of 0.57%), and Lithuanian (10.5%, a difference of 0.62%).
| Demographics | Rating | Rank | Poverty |
| Assyrians/Chaldeans/Syriacs | 99.9 /100 | #6 | Exceptional 10.1% |
| Filipinos | 99.9 /100 | #7 | Exceptional 10.1% |
| Maltese | 99.9 /100 | #8 | Exceptional 10.2% |
| Immigrants | South Central Asia | 99.9 /100 | #9 | Exceptional 10.2% |
| Bulgarians | 99.9 /100 | #10 | Exceptional 10.2% |
| Immigrants | Lithuania | 99.9 /100 | #11 | Exceptional 10.3% |
| Bhutanese | 99.8 /100 | #12 | Exceptional 10.4% |
| Immigrants | Hong Kong | 99.8 /100 | #13 | Exceptional 10.4% |
| Immigrants | Bolivia | 99.8 /100 | #14 | Exceptional 10.4% |
| Bolivians | 99.8 /100 | #15 | Exceptional 10.4% |
| Lithuanians | 99.8 /100 | #16 | Exceptional 10.5% |
| Norwegians | 99.8 /100 | #17 | Exceptional 10.5% |
| Latvians | 99.8 /100 | #18 | Exceptional 10.5% |
| Immigrants | Scotland | 99.7 /100 | #19 | Exceptional 10.6% |
| Immigrants | North Macedonia | 99.7 /100 | #20 | Exceptional 10.6% |
Demographics Similar to Native Hawaiians by Poverty
In terms of poverty, the demographic groups most similar to Native Hawaiians are Portuguese (11.6%, a difference of 0.020%), Immigrants from Zimbabwe (11.6%, a difference of 0.020%), Laotian (11.6%, a difference of 0.11%), Okinawan (11.6%, a difference of 0.11%), and Palestinian (11.6%, a difference of 0.11%).
| Demographics | Rating | Rank | Poverty |
| Immigrants | Egypt | 94.6 /100 | #97 | Exceptional 11.5% |
| Immigrants | Latvia | 94.5 /100 | #98 | Exceptional 11.5% |
| Immigrants | Indonesia | 94.2 /100 | #99 | Exceptional 11.5% |
| Scottish | 94.0 /100 | #100 | Exceptional 11.5% |
| Slavs | 93.3 /100 | #101 | Exceptional 11.5% |
| Laotians | 92.4 /100 | #102 | Exceptional 11.6% |
| Okinawans | 92.4 /100 | #103 | Exceptional 11.6% |
| Native Hawaiians | 92.1 /100 | #104 | Exceptional 11.6% |
| Portuguese | 92.1 /100 | #105 | Exceptional 11.6% |
| Immigrants | Zimbabwe | 92.1 /100 | #106 | Exceptional 11.6% |
| Palestinians | 91.8 /100 | #107 | Exceptional 11.6% |
| Canadians | 91.7 /100 | #108 | Exceptional 11.6% |
| Immigrants | Turkey | 91.7 /100 | #109 | Exceptional 11.6% |
| Welsh | 91.6 /100 | #110 | Exceptional 11.6% |
| French Canadians | 91.0 /100 | #111 | Exceptional 11.6% |