Immigrants from Cambodia vs Estonian Poverty
COMPARE
Immigrants from Cambodia
Estonian
Poverty
Poverty Comparison
Immigrants from Cambodia
Estonians
13.4%
POVERTY
3.0/ 100
METRIC RATING
219th/ 347
METRIC RANK
11.1%
POVERTY
98.2/ 100
METRIC RATING
56th/ 347
METRIC RANK
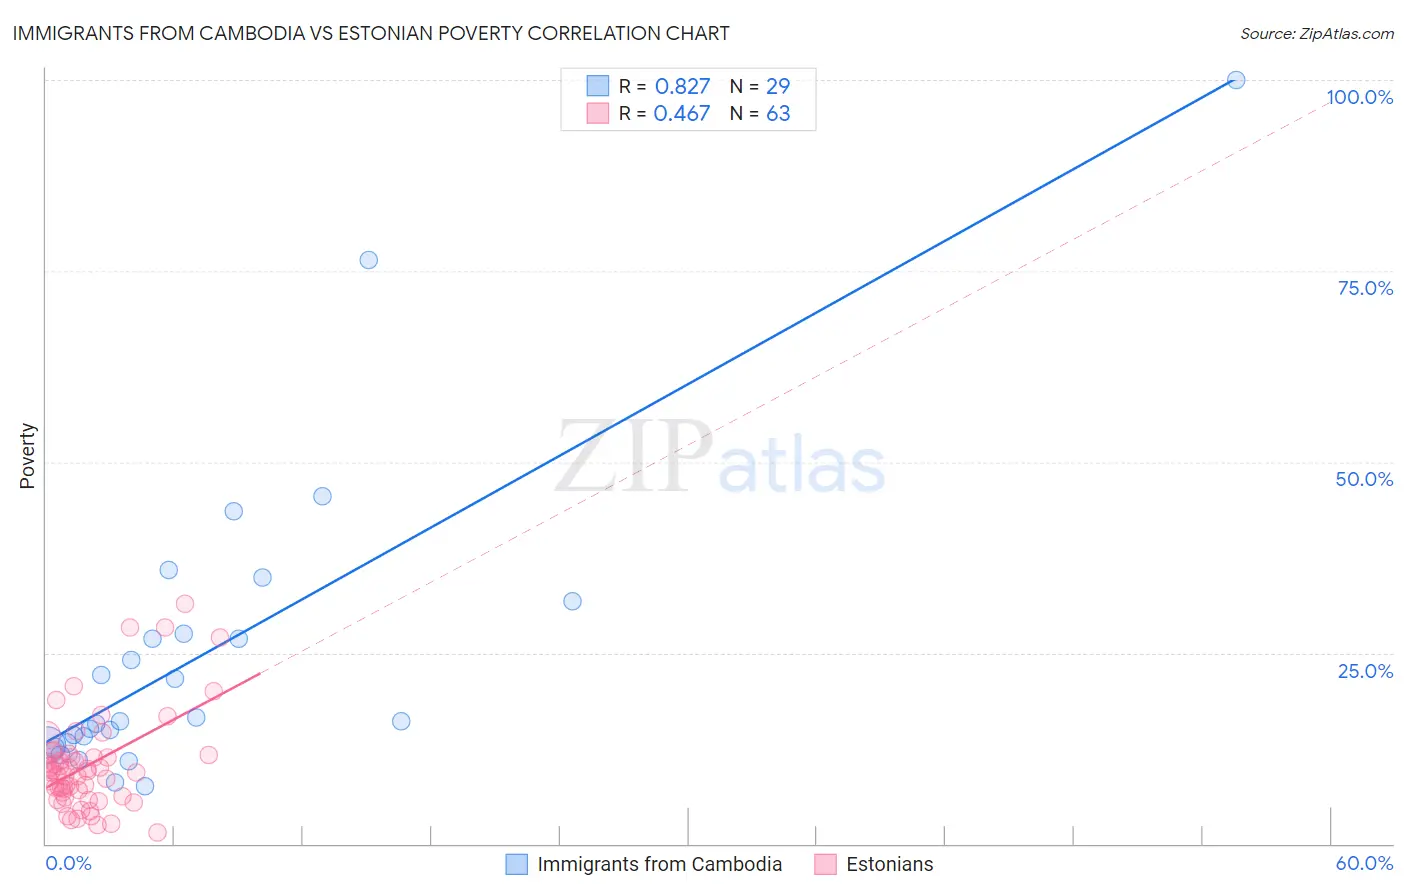
Immigrants from Cambodia vs Estonian Poverty Correlation Chart
The statistical analysis conducted on geographies consisting of 205,130,187 people shows a very strong positive correlation between the proportion of Immigrants from Cambodia and poverty level in the United States with a correlation coefficient (R) of 0.827 and weighted average of 13.4%. Similarly, the statistical analysis conducted on geographies consisting of 123,503,598 people shows a moderate positive correlation between the proportion of Estonians and poverty level in the United States with a correlation coefficient (R) of 0.467 and weighted average of 11.1%, a difference of 20.1%.
Poverty Correlation Summary
| Measurement | Immigrants from Cambodia | Estonian |
| Minimum | 7.5% | 1.5% |
| Maximum | 100.0% | 31.4% |
| Range | 92.5% | 29.8% |
| Mean | 25.1% | 10.3% |
| Median | 16.0% | 9.4% |
| Interquartile 25% (IQ1) | 13.1% | 6.2% |
| Interquartile 75% (IQ3) | 29.7% | 11.7% |
| Interquartile Range (IQR) | 16.6% | 5.5% |
| Standard Deviation (Sample) | 20.4% | 6.3% |
| Standard Deviation (Population) | 20.1% | 6.3% |
Similar Demographics by Poverty
Demographics Similar to Immigrants from Cambodia by Poverty
In terms of poverty, the demographic groups most similar to Immigrants from Cambodia are American (13.4%, a difference of 0.090%), Immigrants from Thailand (13.3%, a difference of 0.12%), Immigrants from Uzbekistan (13.3%, a difference of 0.19%), Japanese (13.3%, a difference of 0.23%), and Nonimmigrants (13.3%, a difference of 0.23%).
| Demographics | Rating | Rank | Poverty |
| Immigrants | Immigrants | 4.3 /100 | #212 | Tragic 13.2% |
| Immigrants | Panama | 4.1 /100 | #213 | Tragic 13.3% |
| Bermudans | 3.7 /100 | #214 | Tragic 13.3% |
| Japanese | 3.3 /100 | #215 | Tragic 13.3% |
| Immigrants | Nonimmigrants | 3.3 /100 | #216 | Tragic 13.3% |
| Immigrants | Uzbekistan | 3.2 /100 | #217 | Tragic 13.3% |
| Immigrants | Thailand | 3.1 /100 | #218 | Tragic 13.3% |
| Immigrants | Cambodia | 3.0 /100 | #219 | Tragic 13.4% |
| Americans | 2.9 /100 | #220 | Tragic 13.4% |
| Alsatians | 2.6 /100 | #221 | Tragic 13.4% |
| Immigrants | Micronesia | 2.6 /100 | #222 | Tragic 13.4% |
| Immigrants | Africa | 2.5 /100 | #223 | Tragic 13.4% |
| Immigrants | Eritrea | 2.4 /100 | #224 | Tragic 13.4% |
| German Russians | 2.2 /100 | #225 | Tragic 13.4% |
| Marshallese | 2.2 /100 | #226 | Tragic 13.4% |
Demographics Similar to Estonians by Poverty
In terms of poverty, the demographic groups most similar to Estonians are Scandinavian (11.1%, a difference of 0.040%), German (11.1%, a difference of 0.10%), Immigrants from Europe (11.2%, a difference of 0.25%), Immigrants from Sri Lanka (11.2%, a difference of 0.42%), and Immigrants from Serbia (11.1%, a difference of 0.48%).
| Demographics | Rating | Rank | Poverty |
| Immigrants | Japan | 98.9 /100 | #49 | Exceptional 11.0% |
| Asians | 98.9 /100 | #50 | Exceptional 11.0% |
| Immigrants | Croatia | 98.7 /100 | #51 | Exceptional 11.0% |
| Immigrants | Philippines | 98.7 /100 | #52 | Exceptional 11.0% |
| Immigrants | Austria | 98.6 /100 | #53 | Exceptional 11.1% |
| Immigrants | Bulgaria | 98.5 /100 | #54 | Exceptional 11.1% |
| Immigrants | Serbia | 98.5 /100 | #55 | Exceptional 11.1% |
| Estonians | 98.2 /100 | #56 | Exceptional 11.1% |
| Scandinavians | 98.2 /100 | #57 | Exceptional 11.1% |
| Germans | 98.1 /100 | #58 | Exceptional 11.1% |
| Immigrants | Europe | 98.0 /100 | #59 | Exceptional 11.2% |
| Immigrants | Sri Lanka | 97.9 /100 | #60 | Exceptional 11.2% |
| Immigrants | Italy | 97.9 /100 | #61 | Exceptional 11.2% |
| Austrians | 97.8 /100 | #62 | Exceptional 11.2% |
| Ukrainians | 97.8 /100 | #63 | Exceptional 11.2% |