Maltese vs Estonian Poverty
COMPARE
Maltese
Estonian
Poverty
Poverty Comparison
Maltese
Estonians
10.2%
POVERTY
99.9/ 100
METRIC RATING
8th/ 347
METRIC RANK
11.1%
POVERTY
98.2/ 100
METRIC RATING
56th/ 347
METRIC RANK
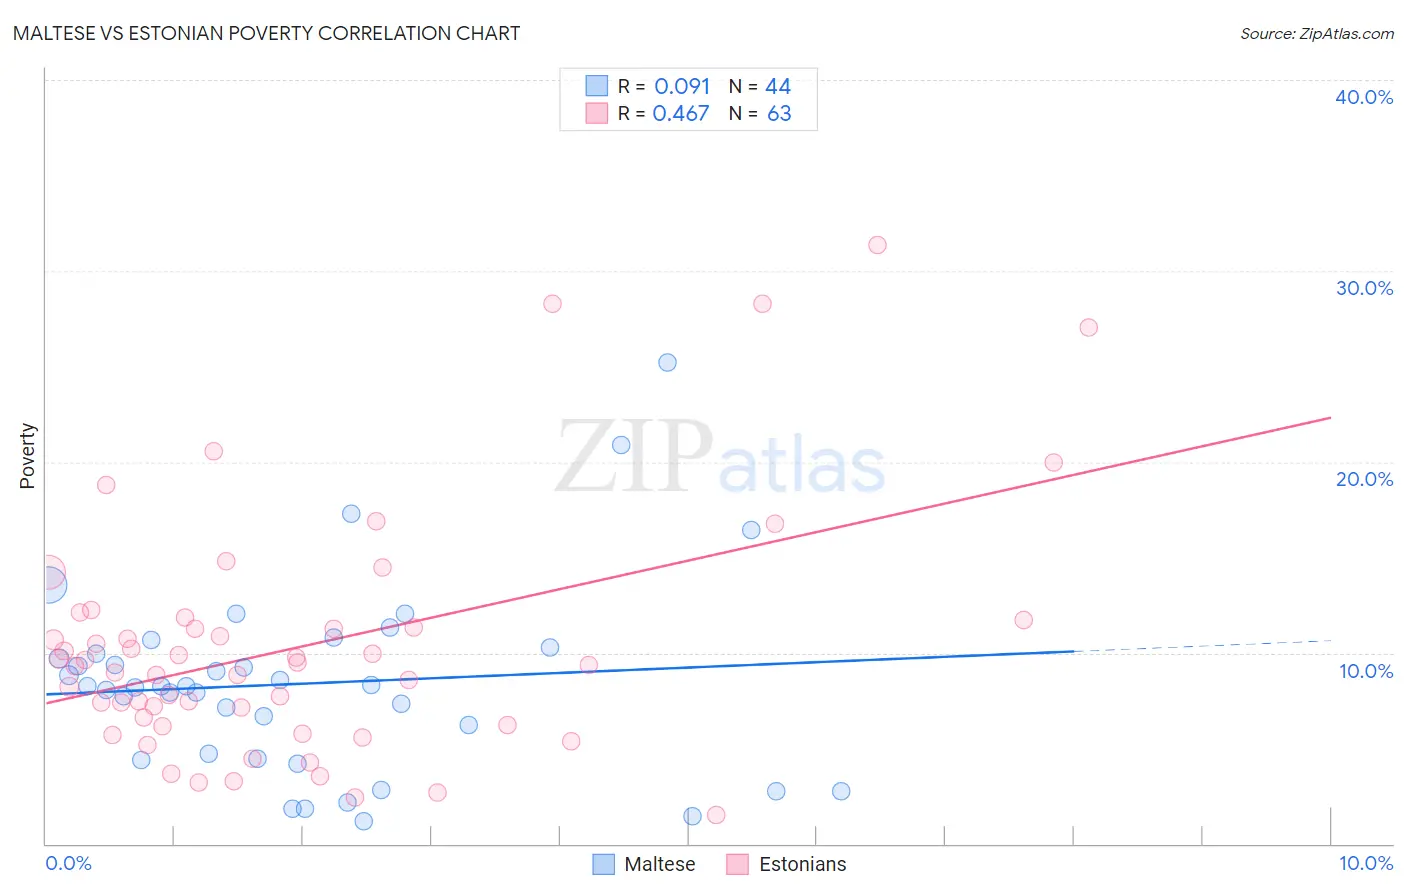
Maltese vs Estonian Poverty Correlation Chart
The statistical analysis conducted on geographies consisting of 126,440,716 people shows a slight positive correlation between the proportion of Maltese and poverty level in the United States with a correlation coefficient (R) of 0.091 and weighted average of 10.2%. Similarly, the statistical analysis conducted on geographies consisting of 123,503,598 people shows a moderate positive correlation between the proportion of Estonians and poverty level in the United States with a correlation coefficient (R) of 0.467 and weighted average of 11.1%, a difference of 9.5%.
Poverty Correlation Summary
| Measurement | Maltese | Estonian |
| Minimum | 1.2% | 1.5% |
| Maximum | 25.2% | 31.4% |
| Range | 24.1% | 29.8% |
| Mean | 8.4% | 10.3% |
| Median | 8.2% | 9.4% |
| Interquartile 25% (IQ1) | 4.6% | 6.2% |
| Interquartile 75% (IQ3) | 10.1% | 11.7% |
| Interquartile Range (IQR) | 5.5% | 5.5% |
| Standard Deviation (Sample) | 5.0% | 6.3% |
| Standard Deviation (Population) | 4.9% | 6.3% |
Similar Demographics by Poverty
Demographics Similar to Maltese by Poverty
In terms of poverty, the demographic groups most similar to Maltese are Filipino (10.1%, a difference of 0.42%), Immigrants from South Central Asia (10.2%, a difference of 0.45%), Assyrian/Chaldean/Syriac (10.1%, a difference of 0.56%), Immigrants from Ireland (10.1%, a difference of 0.74%), and Bulgarian (10.2%, a difference of 0.86%).
| Demographics | Rating | Rank | Poverty |
| Immigrants | India | 100.0 /100 | #1 | Exceptional 9.0% |
| Chinese | 100.0 /100 | #2 | Exceptional 9.5% |
| Thais | 100.0 /100 | #3 | Exceptional 9.6% |
| Immigrants | Taiwan | 100.0 /100 | #4 | Exceptional 9.7% |
| Immigrants | Ireland | 99.9 /100 | #5 | Exceptional 10.1% |
| Assyrians/Chaldeans/Syriacs | 99.9 /100 | #6 | Exceptional 10.1% |
| Filipinos | 99.9 /100 | #7 | Exceptional 10.1% |
| Maltese | 99.9 /100 | #8 | Exceptional 10.2% |
| Immigrants | South Central Asia | 99.9 /100 | #9 | Exceptional 10.2% |
| Bulgarians | 99.9 /100 | #10 | Exceptional 10.2% |
| Immigrants | Lithuania | 99.9 /100 | #11 | Exceptional 10.3% |
| Bhutanese | 99.8 /100 | #12 | Exceptional 10.4% |
| Immigrants | Hong Kong | 99.8 /100 | #13 | Exceptional 10.4% |
| Immigrants | Bolivia | 99.8 /100 | #14 | Exceptional 10.4% |
| Bolivians | 99.8 /100 | #15 | Exceptional 10.4% |
Demographics Similar to Estonians by Poverty
In terms of poverty, the demographic groups most similar to Estonians are Scandinavian (11.1%, a difference of 0.040%), German (11.1%, a difference of 0.10%), Immigrants from Europe (11.2%, a difference of 0.25%), Immigrants from Sri Lanka (11.2%, a difference of 0.42%), and Immigrants from Serbia (11.1%, a difference of 0.48%).
| Demographics | Rating | Rank | Poverty |
| Immigrants | Japan | 98.9 /100 | #49 | Exceptional 11.0% |
| Asians | 98.9 /100 | #50 | Exceptional 11.0% |
| Immigrants | Croatia | 98.7 /100 | #51 | Exceptional 11.0% |
| Immigrants | Philippines | 98.7 /100 | #52 | Exceptional 11.0% |
| Immigrants | Austria | 98.6 /100 | #53 | Exceptional 11.1% |
| Immigrants | Bulgaria | 98.5 /100 | #54 | Exceptional 11.1% |
| Immigrants | Serbia | 98.5 /100 | #55 | Exceptional 11.1% |
| Estonians | 98.2 /100 | #56 | Exceptional 11.1% |
| Scandinavians | 98.2 /100 | #57 | Exceptional 11.1% |
| Germans | 98.1 /100 | #58 | Exceptional 11.1% |
| Immigrants | Europe | 98.0 /100 | #59 | Exceptional 11.2% |
| Immigrants | Sri Lanka | 97.9 /100 | #60 | Exceptional 11.2% |
| Immigrants | Italy | 97.9 /100 | #61 | Exceptional 11.2% |
| Austrians | 97.8 /100 | #62 | Exceptional 11.2% |
| Ukrainians | 97.8 /100 | #63 | Exceptional 11.2% |