Immigrants from Croatia vs Canadian Householder Income Ages 25 - 44 years
COMPARE
Immigrants from Croatia
Canadian
Householder Income Ages 25 - 44 years
Householder Income Ages 25 - 44 years Comparison
Immigrants from Croatia
Canadians
$104,503
HOUSEHOLDER INCOME AGES 25 - 44 YEARS
99.6/ 100
METRIC RATING
70th/ 347
METRIC RANK
$97,625
HOUSEHOLDER INCOME AGES 25 - 44 YEARS
84.5/ 100
METRIC RATING
134th/ 347
METRIC RANK
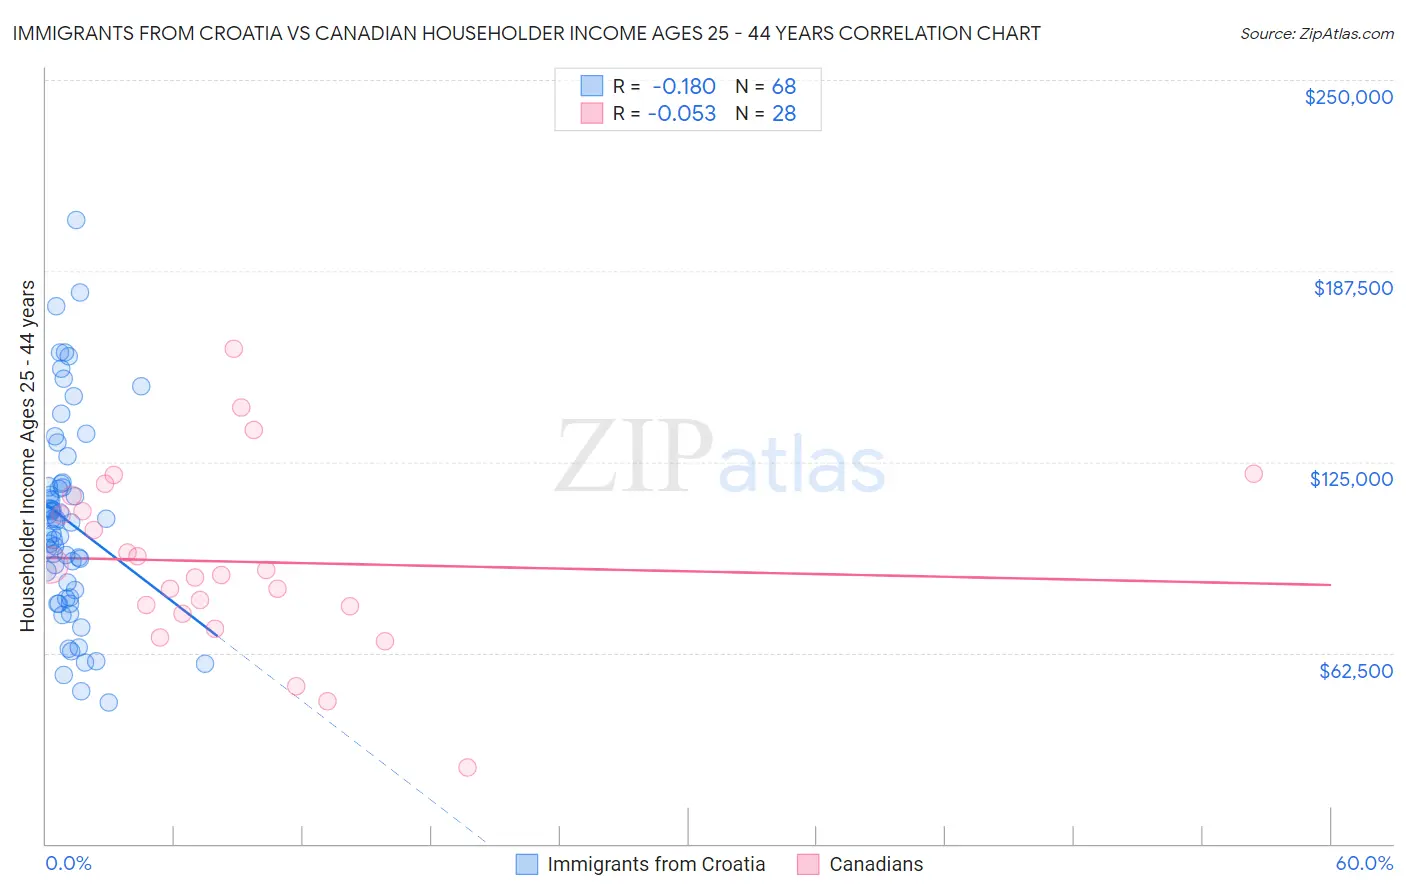
Immigrants from Croatia vs Canadian Householder Income Ages 25 - 44 years Correlation Chart
The statistical analysis conducted on geographies consisting of 132,471,786 people shows a poor negative correlation between the proportion of Immigrants from Croatia and household income with householder between the ages 25 and 44 in the United States with a correlation coefficient (R) of -0.180 and weighted average of $104,503. Similarly, the statistical analysis conducted on geographies consisting of 435,952,621 people shows a slight negative correlation between the proportion of Canadians and household income with householder between the ages 25 and 44 in the United States with a correlation coefficient (R) of -0.053 and weighted average of $97,625, a difference of 7.0%.
Householder Income Ages 25 - 44 years Correlation Summary
| Measurement | Immigrants from Croatia | Canadian |
| Minimum | $46,094 | $24,946 |
| Maximum | $204,358 | $162,133 |
| Range | $158,264 | $137,187 |
| Mean | $105,655 | $92,304 |
| Median | $105,430 | $88,643 |
| Interquartile 25% (IQ1) | $81,770 | $76,629 |
| Interquartile 75% (IQ3) | $117,378 | $111,424 |
| Interquartile Range (IQR) | $35,608 | $34,795 |
| Standard Deviation (Sample) | $32,858 | $29,698 |
| Standard Deviation (Population) | $32,615 | $29,162 |
Similar Demographics by Householder Income Ages 25 - 44 years
Demographics Similar to Immigrants from Croatia by Householder Income Ages 25 - 44 years
In terms of householder income ages 25 - 44 years, the demographic groups most similar to Immigrants from Croatia are Mongolian ($104,578, a difference of 0.070%), Afghan ($104,410, a difference of 0.090%), Immigrants from Eastern Europe ($104,662, a difference of 0.15%), Immigrants from Romania ($104,713, a difference of 0.20%), and Chinese ($104,264, a difference of 0.23%).
| Demographics | Rating | Rank | Householder Income Ages 25 - 44 years |
| Immigrants | Scotland | 99.7 /100 | #63 | Exceptional $105,089 |
| New Zealanders | 99.7 /100 | #64 | Exceptional $105,085 |
| Immigrants | Netherlands | 99.7 /100 | #65 | Exceptional $105,082 |
| Laotians | 99.7 /100 | #66 | Exceptional $104,993 |
| Immigrants | Romania | 99.6 /100 | #67 | Exceptional $104,713 |
| Immigrants | Eastern Europe | 99.6 /100 | #68 | Exceptional $104,662 |
| Mongolians | 99.6 /100 | #69 | Exceptional $104,578 |
| Immigrants | Croatia | 99.6 /100 | #70 | Exceptional $104,503 |
| Afghans | 99.6 /100 | #71 | Exceptional $104,410 |
| Chinese | 99.5 /100 | #72 | Exceptional $104,264 |
| Italians | 99.5 /100 | #73 | Exceptional $104,215 |
| Immigrants | Fiji | 99.5 /100 | #74 | Exceptional $103,954 |
| Koreans | 99.4 /100 | #75 | Exceptional $103,824 |
| Immigrants | Spain | 99.4 /100 | #76 | Exceptional $103,752 |
| Immigrants | Southern Europe | 99.3 /100 | #77 | Exceptional $103,486 |
Demographics Similar to Canadians by Householder Income Ages 25 - 44 years
In terms of householder income ages 25 - 44 years, the demographic groups most similar to Canadians are Immigrants from Oceania ($97,623, a difference of 0.0%), Hungarian ($97,544, a difference of 0.080%), Tsimshian ($97,809, a difference of 0.19%), Immigrants from Zimbabwe ($97,880, a difference of 0.26%), and Lebanese ($97,339, a difference of 0.29%).
| Demographics | Rating | Rank | Householder Income Ages 25 - 44 years |
| Serbians | 88.9 /100 | #127 | Excellent $98,320 |
| Europeans | 88.9 /100 | #128 | Excellent $98,310 |
| Brazilians | 88.6 /100 | #129 | Excellent $98,267 |
| Immigrants | Kuwait | 87.8 /100 | #130 | Excellent $98,122 |
| Immigrants | Albania | 86.6 /100 | #131 | Excellent $97,929 |
| Immigrants | Zimbabwe | 86.3 /100 | #132 | Excellent $97,880 |
| Tsimshian | 85.8 /100 | #133 | Excellent $97,809 |
| Canadians | 84.5 /100 | #134 | Excellent $97,625 |
| Immigrants | Oceania | 84.5 /100 | #135 | Excellent $97,623 |
| Hungarians | 83.9 /100 | #136 | Excellent $97,544 |
| Lebanese | 82.3 /100 | #137 | Excellent $97,339 |
| Arabs | 82.3 /100 | #138 | Excellent $97,336 |
| Immigrants | Peru | 82.2 /100 | #139 | Excellent $97,329 |
| Immigrants | Morocco | 82.0 /100 | #140 | Excellent $97,305 |
| Luxembourgers | 81.5 /100 | #141 | Excellent $97,237 |