Immigrants from Costa Rica vs Colville Female Disability
COMPARE
Immigrants from Costa Rica
Colville
Female Disability
Female Disability Comparison
Immigrants from Costa Rica
Colville
11.7%
FEMALE DISABILITY
98.4/ 100
METRIC RATING
101st/ 347
METRIC RANK
15.1%
FEMALE DISABILITY
0.0/ 100
METRIC RATING
339th/ 347
METRIC RANK
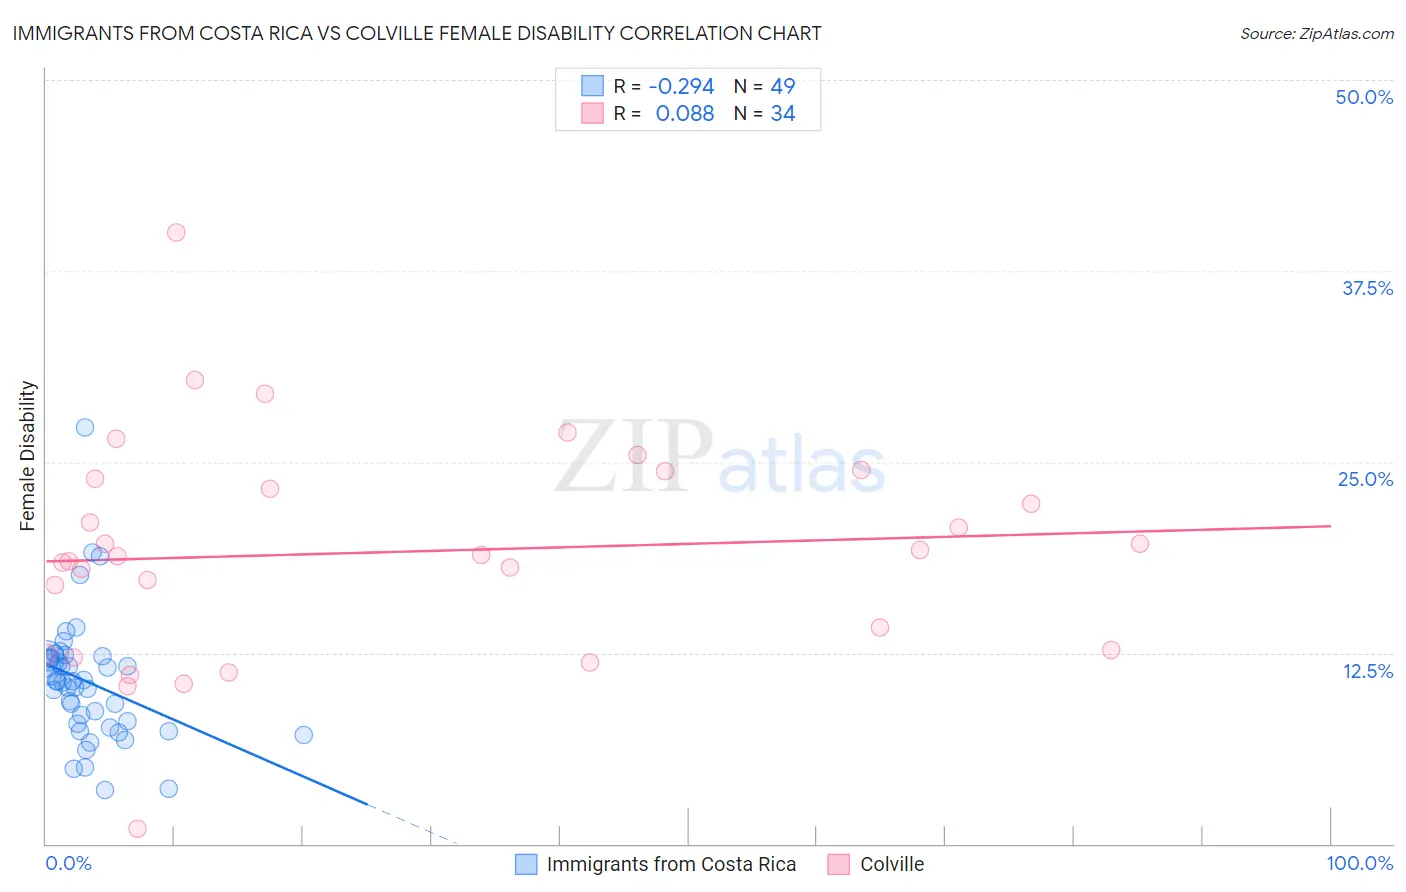
Immigrants from Costa Rica vs Colville Female Disability Correlation Chart
The statistical analysis conducted on geographies consisting of 204,259,041 people shows a weak negative correlation between the proportion of Immigrants from Costa Rica and percentage of females with a disability in the United States with a correlation coefficient (R) of -0.294 and weighted average of 11.7%. Similarly, the statistical analysis conducted on geographies consisting of 34,687,480 people shows a slight positive correlation between the proportion of Colville and percentage of females with a disability in the United States with a correlation coefficient (R) of 0.088 and weighted average of 15.1%, a difference of 28.6%.
Female Disability Correlation Summary
| Measurement | Immigrants from Costa Rica | Colville |
| Minimum | 3.5% | 0.95% |
| Maximum | 27.3% | 40.0% |
| Range | 23.7% | 39.1% |
| Mean | 10.6% | 19.1% |
| Median | 10.7% | 18.9% |
| Interquartile 25% (IQ1) | 7.7% | 12.7% |
| Interquartile 75% (IQ3) | 12.2% | 23.9% |
| Interquartile Range (IQR) | 4.5% | 11.3% |
| Standard Deviation (Sample) | 4.1% | 7.3% |
| Standard Deviation (Population) | 4.1% | 7.2% |
Similar Demographics by Female Disability
Demographics Similar to Immigrants from Costa Rica by Female Disability
In terms of female disability, the demographic groups most similar to Immigrants from Costa Rica are Immigrants from South Eastern Asia (11.7%, a difference of 0.010%), Immigrants from Uruguay (11.7%, a difference of 0.020%), Immigrants from Philippines (11.7%, a difference of 0.070%), Immigrants from Eastern Africa (11.7%, a difference of 0.080%), and Immigrants from Western Asia (11.7%, a difference of 0.090%).
| Demographics | Rating | Rank | Female Disability |
| Immigrants | Brazil | 99.4 /100 | #94 | Exceptional 11.6% |
| Immigrants | Northern Europe | 99.4 /100 | #95 | Exceptional 11.6% |
| Immigrants | Russia | 99.0 /100 | #96 | Exceptional 11.7% |
| Koreans | 99.0 /100 | #97 | Exceptional 11.7% |
| Uruguayans | 98.8 /100 | #98 | Exceptional 11.7% |
| Immigrants | Philippines | 98.6 /100 | #99 | Exceptional 11.7% |
| Immigrants | Uruguay | 98.5 /100 | #100 | Exceptional 11.7% |
| Immigrants | Costa Rica | 98.4 /100 | #101 | Exceptional 11.7% |
| Immigrants | South Eastern Asia | 98.4 /100 | #102 | Exceptional 11.7% |
| Immigrants | Eastern Africa | 98.3 /100 | #103 | Exceptional 11.7% |
| Immigrants | Western Asia | 98.3 /100 | #104 | Exceptional 11.7% |
| Australians | 98.3 /100 | #105 | Exceptional 11.7% |
| Immigrants | Greece | 98.2 /100 | #106 | Exceptional 11.7% |
| Latvians | 98.2 /100 | #107 | Exceptional 11.7% |
| New Zealanders | 98.1 /100 | #108 | Exceptional 11.7% |
Demographics Similar to Colville by Female Disability
In terms of female disability, the demographic groups most similar to Colville are Dutch West Indian (15.0%, a difference of 0.40%), Tohono O'odham (15.0%, a difference of 0.55%), Seminole (15.0%, a difference of 0.67%), Chickasaw (15.2%, a difference of 0.95%), and Cajun (14.9%, a difference of 1.3%).
| Demographics | Rating | Rank | Female Disability |
| Pima | 0.0 /100 | #332 | Tragic 14.8% |
| Immigrants | Azores | 0.0 /100 | #333 | Tragic 14.9% |
| Cherokee | 0.0 /100 | #334 | Tragic 14.9% |
| Cajuns | 0.0 /100 | #335 | Tragic 14.9% |
| Seminole | 0.0 /100 | #336 | Tragic 15.0% |
| Tohono O'odham | 0.0 /100 | #337 | Tragic 15.0% |
| Dutch West Indians | 0.0 /100 | #338 | Tragic 15.0% |
| Colville | 0.0 /100 | #339 | Tragic 15.1% |
| Chickasaw | 0.0 /100 | #340 | Tragic 15.2% |
| Choctaw | 0.0 /100 | #341 | Tragic 15.4% |
| Creek | 0.0 /100 | #342 | Tragic 15.7% |
| Lumbee | 0.0 /100 | #343 | Tragic 15.8% |
| Kiowa | 0.0 /100 | #344 | Tragic 15.8% |
| Puerto Ricans | 0.0 /100 | #345 | Tragic 16.6% |
| Tsimshian | 0.0 /100 | #346 | Tragic 16.8% |