Immigrants from Colombia vs Lumbee Disability
COMPARE
Immigrants from Colombia
Lumbee
Disability
Disability Comparison
Immigrants from Colombia
Lumbee
10.9%
DISABILITY
99.7/ 100
METRIC RATING
59th/ 347
METRIC RANK
15.5%
DISABILITY
0.0/ 100
METRIC RATING
341st/ 347
METRIC RANK
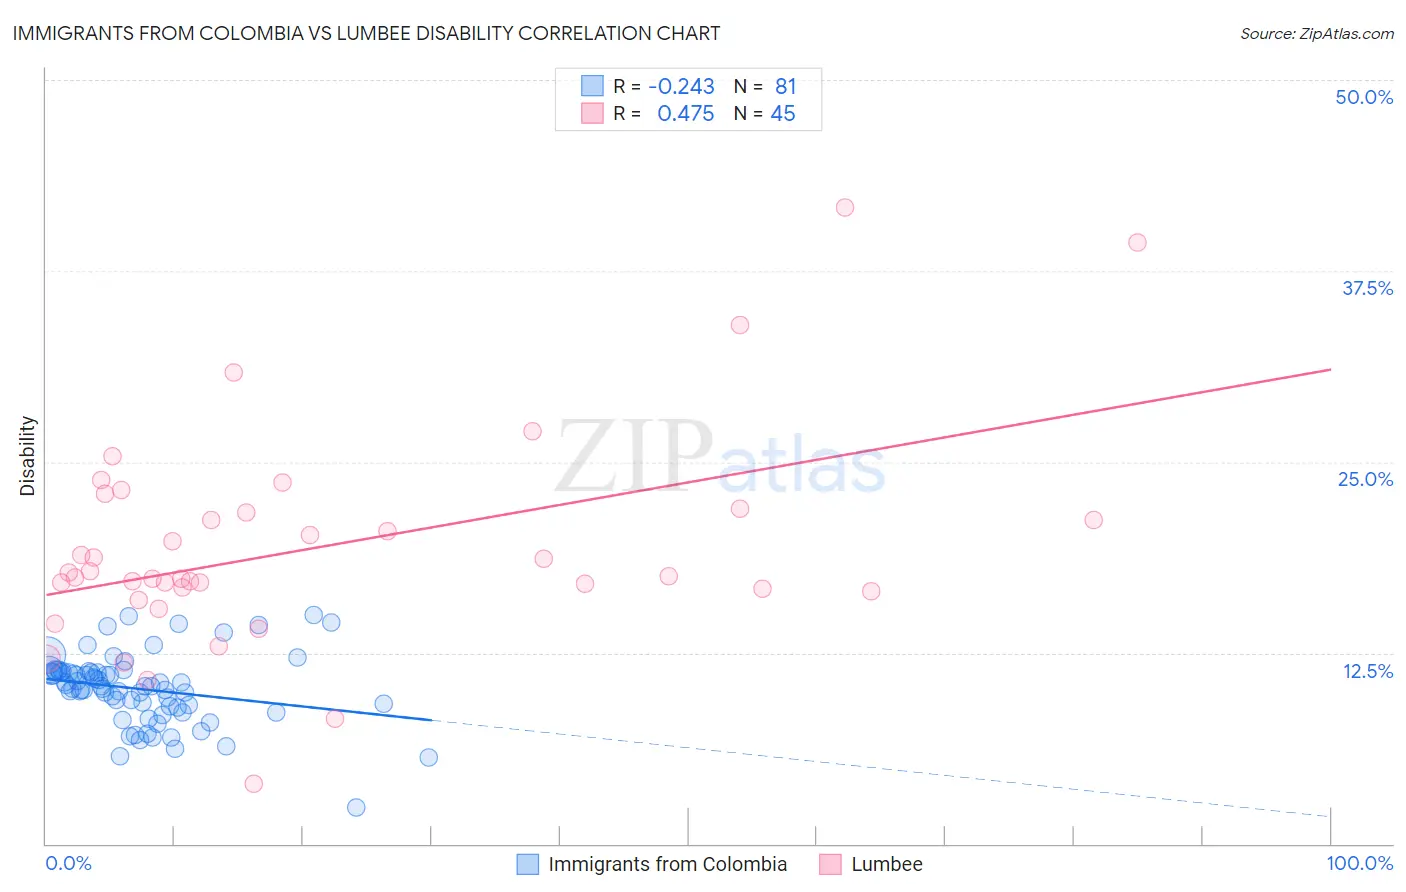
Immigrants from Colombia vs Lumbee Disability Correlation Chart
The statistical analysis conducted on geographies consisting of 378,650,675 people shows a weak negative correlation between the proportion of Immigrants from Colombia and percentage of population with a disability in the United States with a correlation coefficient (R) of -0.243 and weighted average of 10.9%. Similarly, the statistical analysis conducted on geographies consisting of 92,289,178 people shows a moderate positive correlation between the proportion of Lumbee and percentage of population with a disability in the United States with a correlation coefficient (R) of 0.475 and weighted average of 15.5%, a difference of 42.1%.
Disability Correlation Summary
| Measurement | Immigrants from Colombia | Lumbee |
| Minimum | 2.4% | 3.9% |
| Maximum | 14.9% | 41.7% |
| Range | 12.5% | 37.8% |
| Mean | 10.1% | 19.4% |
| Median | 10.3% | 17.5% |
| Interquartile 25% (IQ1) | 8.9% | 16.6% |
| Interquartile 75% (IQ3) | 11.2% | 21.8% |
| Interquartile Range (IQR) | 2.3% | 5.2% |
| Standard Deviation (Sample) | 2.3% | 7.0% |
| Standard Deviation (Population) | 2.3% | 6.9% |
Similar Demographics by Disability
Demographics Similar to Immigrants from Colombia by Disability
In terms of disability, the demographic groups most similar to Immigrants from Colombia are Immigrants from South America (10.9%, a difference of 0.090%), Zimbabwean (10.9%, a difference of 0.090%), Salvadoran (10.9%, a difference of 0.12%), Immigrants from Bulgaria (10.9%, a difference of 0.15%), and Immigrants from Northern Africa (10.9%, a difference of 0.19%).
| Demographics | Rating | Rank | Disability |
| South Americans | 99.8 /100 | #52 | Exceptional 10.9% |
| Immigrants | Spain | 99.8 /100 | #53 | Exceptional 10.9% |
| Jordanians | 99.8 /100 | #54 | Exceptional 10.9% |
| Immigrants | El Salvador | 99.8 /100 | #55 | Exceptional 10.9% |
| Immigrants | Lithuania | 99.8 /100 | #56 | Exceptional 10.9% |
| Salvadorans | 99.8 /100 | #57 | Exceptional 10.9% |
| Immigrants | South America | 99.8 /100 | #58 | Exceptional 10.9% |
| Immigrants | Colombia | 99.7 /100 | #59 | Exceptional 10.9% |
| Zimbabweans | 99.7 /100 | #60 | Exceptional 10.9% |
| Immigrants | Bulgaria | 99.7 /100 | #61 | Exceptional 10.9% |
| Immigrants | Northern Africa | 99.7 /100 | #62 | Exceptional 10.9% |
| Immigrants | Eritrea | 99.7 /100 | #63 | Exceptional 11.0% |
| Immigrants | Sweden | 99.6 /100 | #64 | Exceptional 11.0% |
| Bulgarians | 99.6 /100 | #65 | Exceptional 11.0% |
| Laotians | 99.6 /100 | #66 | Exceptional 11.0% |
Demographics Similar to Lumbee by Disability
In terms of disability, the demographic groups most similar to Lumbee are Kiowa (15.6%, a difference of 0.45%), Creek (15.6%, a difference of 0.47%), Choctaw (15.4%, a difference of 0.84%), Colville (15.8%, a difference of 1.7%), and Chickasaw (15.2%, a difference of 2.3%).
| Demographics | Rating | Rank | Disability |
| Cajuns | 0.0 /100 | #333 | Tragic 14.6% |
| Yuman | 0.0 /100 | #334 | Tragic 14.6% |
| Tohono O'odham | 0.0 /100 | #335 | Tragic 14.8% |
| Cherokee | 0.0 /100 | #336 | Tragic 14.8% |
| Seminole | 0.0 /100 | #337 | Tragic 14.9% |
| Dutch West Indians | 0.0 /100 | #338 | Tragic 14.9% |
| Chickasaw | 0.0 /100 | #339 | Tragic 15.2% |
| Choctaw | 0.0 /100 | #340 | Tragic 15.4% |
| Lumbee | 0.0 /100 | #341 | Tragic 15.5% |
| Kiowa | 0.0 /100 | #342 | Tragic 15.6% |
| Creek | 0.0 /100 | #343 | Tragic 15.6% |
| Colville | 0.0 /100 | #344 | Tragic 15.8% |
| Puerto Ricans | 0.0 /100 | #345 | Tragic 16.1% |
| Tsimshian | 0.0 /100 | #346 | Tragic 16.1% |
| Houma | 0.0 /100 | #347 | Tragic 17.1% |