Immigrants from Cabo Verde vs Luxembourger Receiving Food Stamps
COMPARE
Immigrants from Cabo Verde
Luxembourger
Receiving Food Stamps
Receiving Food Stamps Comparison
Immigrants from Cabo Verde
Luxembourgers
23.8%
RECEIVING FOOD STAMPS
0.0/ 100
METRIC RATING
345th/ 347
METRIC RANK
9.1%
RECEIVING FOOD STAMPS
99.8/ 100
METRIC RATING
21st/ 347
METRIC RANK
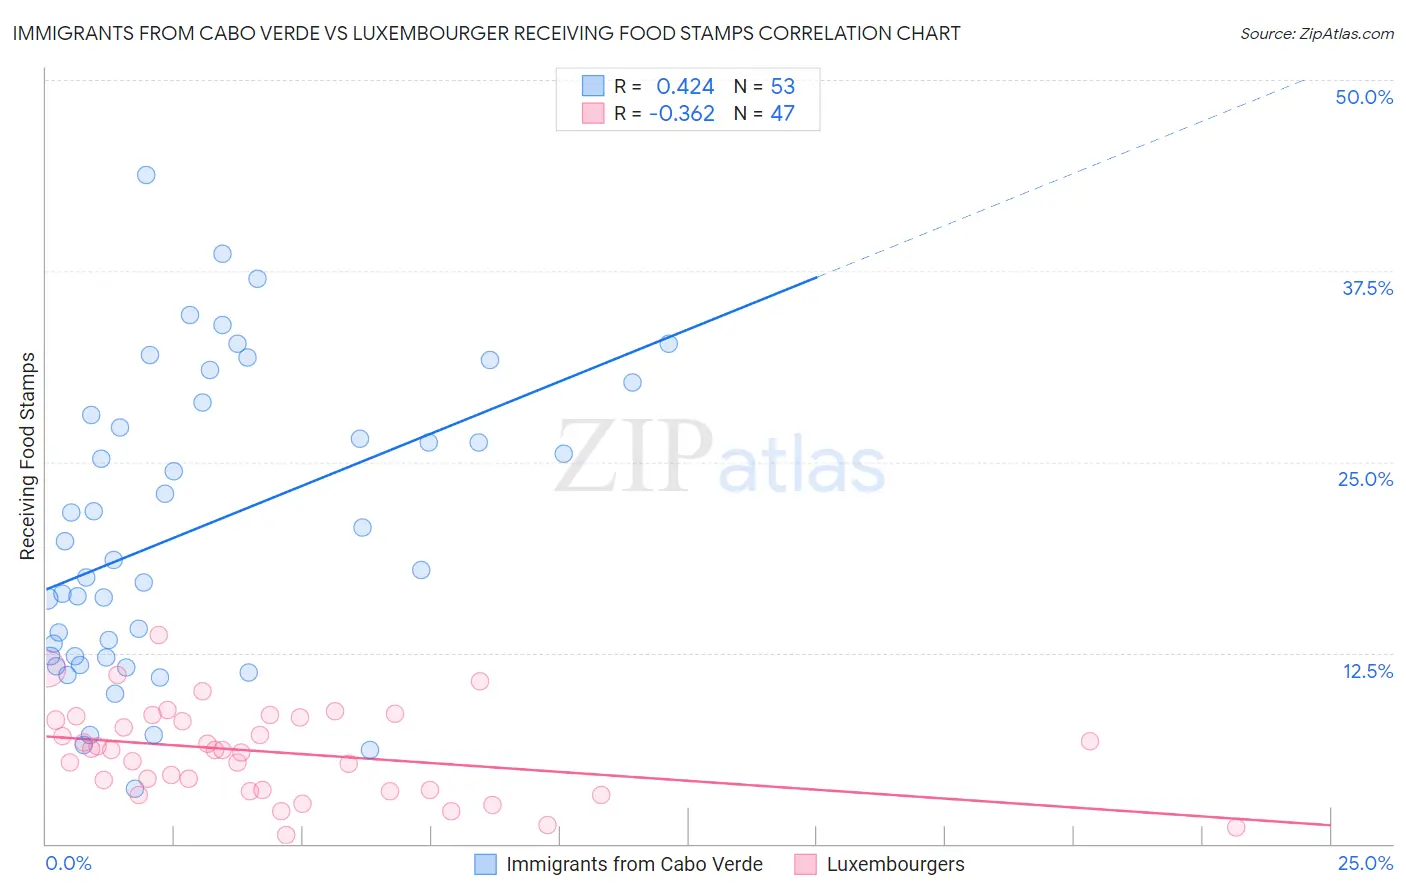
Immigrants from Cabo Verde vs Luxembourger Receiving Food Stamps Correlation Chart
The statistical analysis conducted on geographies consisting of 38,130,553 people shows a moderate positive correlation between the proportion of Immigrants from Cabo Verde and percentage of population receiving government assistance and/or food stamps in the United States with a correlation coefficient (R) of 0.424 and weighted average of 23.8%. Similarly, the statistical analysis conducted on geographies consisting of 144,526,649 people shows a mild negative correlation between the proportion of Luxembourgers and percentage of population receiving government assistance and/or food stamps in the United States with a correlation coefficient (R) of -0.362 and weighted average of 9.1%, a difference of 161.1%.
Receiving Food Stamps Correlation Summary
| Measurement | Immigrants from Cabo Verde | Luxembourger |
| Minimum | 3.6% | 0.57% |
| Maximum | 43.8% | 13.6% |
| Range | 40.2% | 13.1% |
| Mean | 20.6% | 6.0% |
| Median | 18.6% | 6.2% |
| Interquartile 25% (IQ1) | 12.2% | 3.5% |
| Interquartile 75% (IQ3) | 28.5% | 8.2% |
| Interquartile Range (IQR) | 16.3% | 4.7% |
| Standard Deviation (Sample) | 9.7% | 2.9% |
| Standard Deviation (Population) | 9.6% | 2.9% |
Similar Demographics by Receiving Food Stamps
Demographics Similar to Immigrants from Cabo Verde by Receiving Food Stamps
In terms of receiving food stamps, the demographic groups most similar to Immigrants from Cabo Verde are Lumbee (22.9%, a difference of 4.1%), Immigrants from Dominican Republic (22.1%, a difference of 7.8%), Puerto Rican (26.0%, a difference of 8.9%), Immigrants from Yemen (21.6%, a difference of 10.2%), and Hopi (21.6%, a difference of 10.6%).
| Demographics | Rating | Rank | Receiving Food Stamps |
| Inupiat | 0.0 /100 | #333 | Tragic 20.1% |
| Yuman | 0.0 /100 | #334 | Tragic 20.2% |
| Immigrants | Cuba | 0.0 /100 | #335 | Tragic 20.8% |
| Navajo | 0.0 /100 | #336 | Tragic 21.1% |
| Cape Verdeans | 0.0 /100 | #337 | Tragic 21.1% |
| Dominicans | 0.0 /100 | #338 | Tragic 21.4% |
| Yakama | 0.0 /100 | #339 | Tragic 21.4% |
| Tohono O'odham | 0.0 /100 | #340 | Tragic 21.5% |
| Hopi | 0.0 /100 | #341 | Tragic 21.6% |
| Immigrants | Yemen | 0.0 /100 | #342 | Tragic 21.6% |
| Immigrants | Dominican Republic | 0.0 /100 | #343 | Tragic 22.1% |
| Lumbee | 0.0 /100 | #344 | Tragic 22.9% |
| Immigrants | Cabo Verde | 0.0 /100 | #345 | Tragic 23.8% |
| Puerto Ricans | 0.0 /100 | #346 | Tragic 26.0% |
| Yup'ik | 0.0 /100 | #347 | Tragic 32.7% |
Demographics Similar to Luxembourgers by Receiving Food Stamps
In terms of receiving food stamps, the demographic groups most similar to Luxembourgers are Latvian (9.1%, a difference of 0.15%), Immigrants from Australia (9.2%, a difference of 0.25%), Eastern European (9.2%, a difference of 0.36%), Immigrants from Northern Europe (9.2%, a difference of 0.38%), and Immigrants from Hong Kong (9.1%, a difference of 0.48%).
| Demographics | Rating | Rank | Receiving Food Stamps |
| Maltese | 99.9 /100 | #14 | Exceptional 8.9% |
| Norwegians | 99.9 /100 | #15 | Exceptional 9.0% |
| Immigrants | Japan | 99.9 /100 | #16 | Exceptional 9.0% |
| Immigrants | Scotland | 99.9 /100 | #17 | Exceptional 9.0% |
| Danes | 99.9 /100 | #18 | Exceptional 9.0% |
| Immigrants | Hong Kong | 99.8 /100 | #19 | Exceptional 9.1% |
| Latvians | 99.8 /100 | #20 | Exceptional 9.1% |
| Luxembourgers | 99.8 /100 | #21 | Exceptional 9.1% |
| Immigrants | Australia | 99.8 /100 | #22 | Exceptional 9.2% |
| Eastern Europeans | 99.8 /100 | #23 | Exceptional 9.2% |
| Immigrants | Northern Europe | 99.8 /100 | #24 | Exceptional 9.2% |
| Immigrants | Ireland | 99.8 /100 | #25 | Exceptional 9.2% |
| Swedes | 99.8 /100 | #26 | Exceptional 9.2% |
| Bhutanese | 99.8 /100 | #27 | Exceptional 9.2% |
| Czechs | 99.8 /100 | #28 | Exceptional 9.2% |