Immigrants from Cabo Verde vs Bahamian Receiving Food Stamps
COMPARE
Immigrants from Cabo Verde
Bahamian
Receiving Food Stamps
Receiving Food Stamps Comparison
Immigrants from Cabo Verde
Bahamians
23.8%
RECEIVING FOOD STAMPS
0.0/ 100
METRIC RATING
345th/ 347
METRIC RANK
17.0%
RECEIVING FOOD STAMPS
0.0/ 100
METRIC RATING
315th/ 347
METRIC RANK
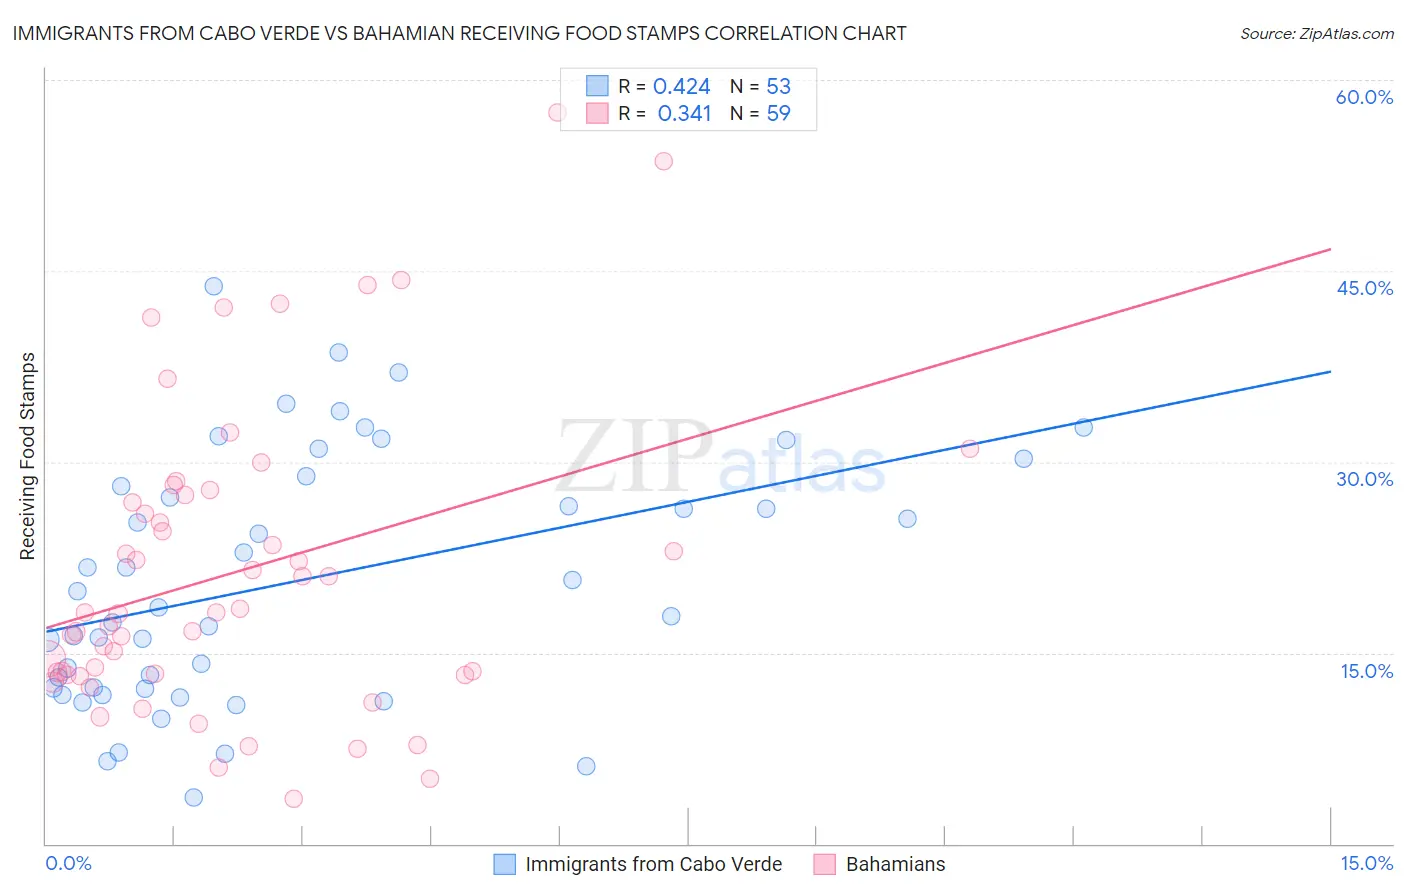
Immigrants from Cabo Verde vs Bahamian Receiving Food Stamps Correlation Chart
The statistical analysis conducted on geographies consisting of 38,130,553 people shows a moderate positive correlation between the proportion of Immigrants from Cabo Verde and percentage of population receiving government assistance and/or food stamps in the United States with a correlation coefficient (R) of 0.424 and weighted average of 23.8%. Similarly, the statistical analysis conducted on geographies consisting of 112,602,600 people shows a mild positive correlation between the proportion of Bahamians and percentage of population receiving government assistance and/or food stamps in the United States with a correlation coefficient (R) of 0.341 and weighted average of 17.0%, a difference of 40.2%.
Receiving Food Stamps Correlation Summary
| Measurement | Immigrants from Cabo Verde | Bahamian |
| Minimum | 3.6% | 3.5% |
| Maximum | 43.8% | 57.4% |
| Range | 40.2% | 53.9% |
| Mean | 20.6% | 21.3% |
| Median | 18.6% | 18.1% |
| Interquartile 25% (IQ1) | 12.2% | 13.3% |
| Interquartile 75% (IQ3) | 28.5% | 27.4% |
| Interquartile Range (IQR) | 16.3% | 14.1% |
| Standard Deviation (Sample) | 9.7% | 11.9% |
| Standard Deviation (Population) | 9.6% | 11.8% |
Similar Demographics by Receiving Food Stamps
Demographics Similar to Immigrants from Cabo Verde by Receiving Food Stamps
In terms of receiving food stamps, the demographic groups most similar to Immigrants from Cabo Verde are Lumbee (22.9%, a difference of 4.1%), Immigrants from Dominican Republic (22.1%, a difference of 7.8%), Puerto Rican (26.0%, a difference of 8.9%), Immigrants from Yemen (21.6%, a difference of 10.2%), and Hopi (21.6%, a difference of 10.6%).
| Demographics | Rating | Rank | Receiving Food Stamps |
| Inupiat | 0.0 /100 | #333 | Tragic 20.1% |
| Yuman | 0.0 /100 | #334 | Tragic 20.2% |
| Immigrants | Cuba | 0.0 /100 | #335 | Tragic 20.8% |
| Navajo | 0.0 /100 | #336 | Tragic 21.1% |
| Cape Verdeans | 0.0 /100 | #337 | Tragic 21.1% |
| Dominicans | 0.0 /100 | #338 | Tragic 21.4% |
| Yakama | 0.0 /100 | #339 | Tragic 21.4% |
| Tohono O'odham | 0.0 /100 | #340 | Tragic 21.5% |
| Hopi | 0.0 /100 | #341 | Tragic 21.6% |
| Immigrants | Yemen | 0.0 /100 | #342 | Tragic 21.6% |
| Immigrants | Dominican Republic | 0.0 /100 | #343 | Tragic 22.1% |
| Lumbee | 0.0 /100 | #344 | Tragic 22.9% |
| Immigrants | Cabo Verde | 0.0 /100 | #345 | Tragic 23.8% |
| Puerto Ricans | 0.0 /100 | #346 | Tragic 26.0% |
| Yup'ik | 0.0 /100 | #347 | Tragic 32.7% |
Demographics Similar to Bahamians by Receiving Food Stamps
In terms of receiving food stamps, the demographic groups most similar to Bahamians are Central American Indian (17.1%, a difference of 0.45%), Immigrants from Guyana (16.9%, a difference of 0.57%), Immigrants from Jamaica (16.9%, a difference of 0.74%), Black/African American (17.2%, a difference of 0.98%), and Sioux (16.8%, a difference of 1.0%).
| Demographics | Rating | Rank | Receiving Food Stamps |
| Barbadians | 0.0 /100 | #308 | Tragic 16.5% |
| U.S. Virgin Islanders | 0.0 /100 | #309 | Tragic 16.5% |
| Immigrants | Barbados | 0.0 /100 | #310 | Tragic 16.6% |
| Guyanese | 0.0 /100 | #311 | Tragic 16.7% |
| Sioux | 0.0 /100 | #312 | Tragic 16.8% |
| Immigrants | Jamaica | 0.0 /100 | #313 | Tragic 16.9% |
| Immigrants | Guyana | 0.0 /100 | #314 | Tragic 16.9% |
| Bahamians | 0.0 /100 | #315 | Tragic 17.0% |
| Central American Indians | 0.0 /100 | #316 | Tragic 17.1% |
| Blacks/African Americans | 0.0 /100 | #317 | Tragic 17.2% |
| Menominee | 0.0 /100 | #318 | Tragic 17.2% |
| Immigrants | St. Vincent and the Grenadines | 0.0 /100 | #319 | Tragic 17.2% |
| Immigrants | Nicaragua | 0.0 /100 | #320 | Tragic 17.2% |
| Natives/Alaskans | 0.0 /100 | #321 | Tragic 17.3% |
| Immigrants | Grenada | 0.0 /100 | #322 | Tragic 17.8% |