Immigrants from Uganda vs Luxembourger Receiving Food Stamps
COMPARE
Immigrants from Uganda
Luxembourger
Receiving Food Stamps
Receiving Food Stamps Comparison
Immigrants from Uganda
Luxembourgers
11.9%
RECEIVING FOOD STAMPS
40.3/ 100
METRIC RATING
183rd/ 347
METRIC RANK
9.1%
RECEIVING FOOD STAMPS
99.8/ 100
METRIC RATING
21st/ 347
METRIC RANK
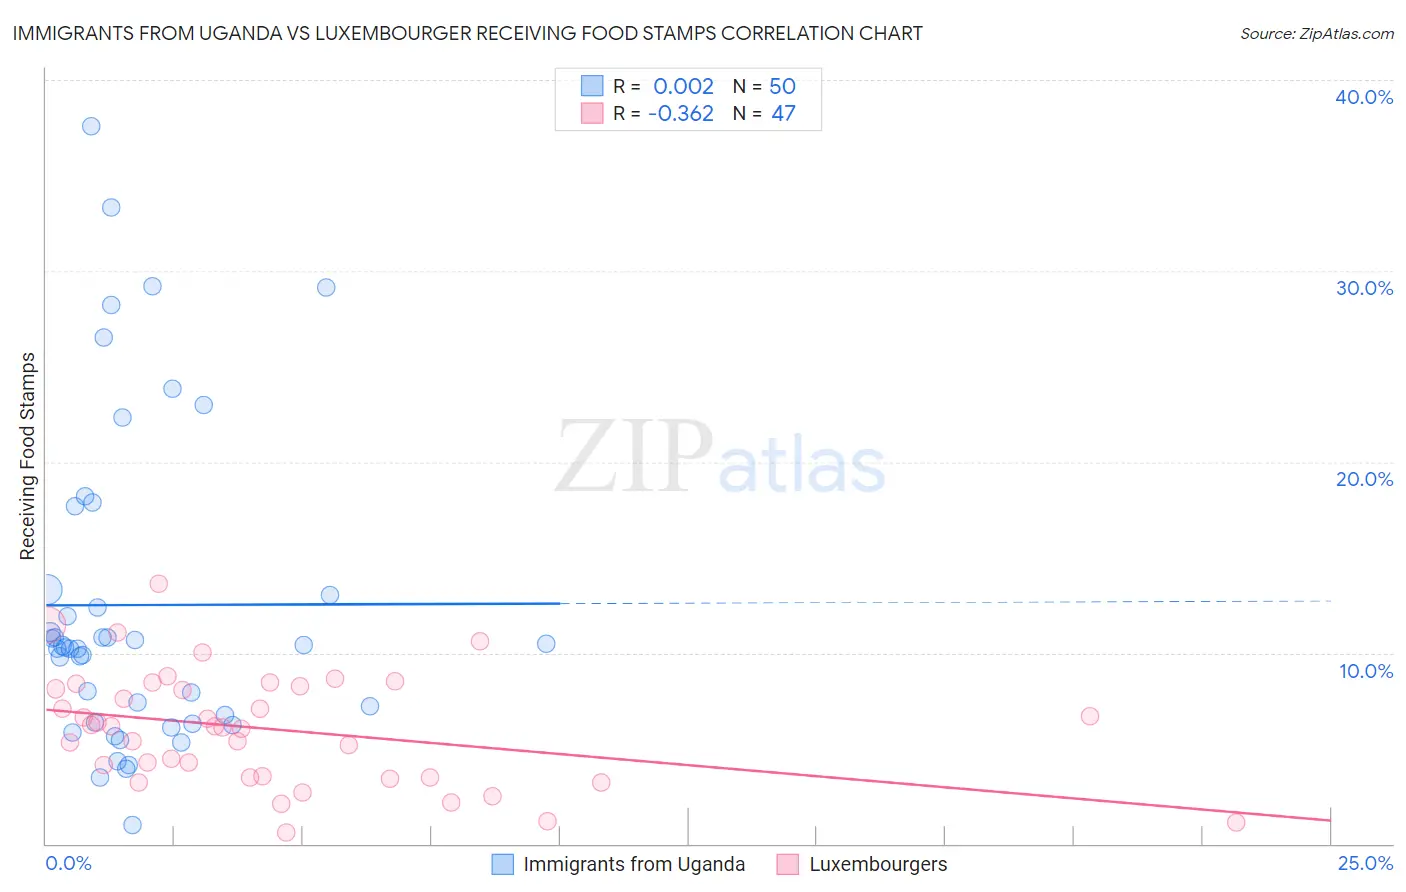
Immigrants from Uganda vs Luxembourger Receiving Food Stamps Correlation Chart
The statistical analysis conducted on geographies consisting of 125,947,478 people shows no correlation between the proportion of Immigrants from Uganda and percentage of population receiving government assistance and/or food stamps in the United States with a correlation coefficient (R) of 0.002 and weighted average of 11.9%. Similarly, the statistical analysis conducted on geographies consisting of 144,526,649 people shows a mild negative correlation between the proportion of Luxembourgers and percentage of population receiving government assistance and/or food stamps in the United States with a correlation coefficient (R) of -0.362 and weighted average of 9.1%, a difference of 30.3%.
Receiving Food Stamps Correlation Summary
| Measurement | Immigrants from Uganda | Luxembourger |
| Minimum | 1.0% | 0.57% |
| Maximum | 37.6% | 13.6% |
| Range | 36.6% | 13.1% |
| Mean | 12.5% | 6.0% |
| Median | 10.3% | 6.2% |
| Interquartile 25% (IQ1) | 6.4% | 3.5% |
| Interquartile 75% (IQ3) | 13.3% | 8.2% |
| Interquartile Range (IQR) | 6.9% | 4.7% |
| Standard Deviation (Sample) | 8.4% | 2.9% |
| Standard Deviation (Population) | 8.3% | 2.9% |
Similar Demographics by Receiving Food Stamps
Demographics Similar to Immigrants from Uganda by Receiving Food Stamps
In terms of receiving food stamps, the demographic groups most similar to Immigrants from Uganda are Immigrants from Morocco (11.9%, a difference of 0.060%), Spaniard (11.9%, a difference of 0.080%), South American Indian (11.9%, a difference of 0.20%), Immigrants from Iraq (12.0%, a difference of 0.46%), and Spanish (12.0%, a difference of 0.50%).
| Demographics | Rating | Rank | Receiving Food Stamps |
| Peruvians | 49.3 /100 | #176 | Average 11.7% |
| Immigrants | Ukraine | 48.4 /100 | #177 | Average 11.8% |
| German Russians | 48.1 /100 | #178 | Average 11.8% |
| Immigrants | Kenya | 46.4 /100 | #179 | Average 11.8% |
| Uruguayans | 44.8 /100 | #180 | Average 11.8% |
| South American Indians | 41.7 /100 | #181 | Average 11.9% |
| Immigrants | Morocco | 40.7 /100 | #182 | Average 11.9% |
| Immigrants | Uganda | 40.3 /100 | #183 | Average 11.9% |
| Spaniards | 39.8 /100 | #184 | Fair 11.9% |
| Immigrants | Iraq | 37.1 /100 | #185 | Fair 12.0% |
| Spanish | 36.9 /100 | #186 | Fair 12.0% |
| Albanians | 35.4 /100 | #187 | Fair 12.0% |
| Sudanese | 33.4 /100 | #188 | Fair 12.0% |
| Immigrants | Cameroon | 32.5 /100 | #189 | Fair 12.0% |
| Immigrants | Peru | 32.2 /100 | #190 | Fair 12.0% |
Demographics Similar to Luxembourgers by Receiving Food Stamps
In terms of receiving food stamps, the demographic groups most similar to Luxembourgers are Latvian (9.1%, a difference of 0.15%), Immigrants from Australia (9.2%, a difference of 0.25%), Eastern European (9.2%, a difference of 0.36%), Immigrants from Northern Europe (9.2%, a difference of 0.38%), and Immigrants from Hong Kong (9.1%, a difference of 0.48%).
| Demographics | Rating | Rank | Receiving Food Stamps |
| Maltese | 99.9 /100 | #14 | Exceptional 8.9% |
| Norwegians | 99.9 /100 | #15 | Exceptional 9.0% |
| Immigrants | Japan | 99.9 /100 | #16 | Exceptional 9.0% |
| Immigrants | Scotland | 99.9 /100 | #17 | Exceptional 9.0% |
| Danes | 99.9 /100 | #18 | Exceptional 9.0% |
| Immigrants | Hong Kong | 99.8 /100 | #19 | Exceptional 9.1% |
| Latvians | 99.8 /100 | #20 | Exceptional 9.1% |
| Luxembourgers | 99.8 /100 | #21 | Exceptional 9.1% |
| Immigrants | Australia | 99.8 /100 | #22 | Exceptional 9.2% |
| Eastern Europeans | 99.8 /100 | #23 | Exceptional 9.2% |
| Immigrants | Northern Europe | 99.8 /100 | #24 | Exceptional 9.2% |
| Immigrants | Ireland | 99.8 /100 | #25 | Exceptional 9.2% |
| Swedes | 99.8 /100 | #26 | Exceptional 9.2% |
| Bhutanese | 99.8 /100 | #27 | Exceptional 9.2% |
| Czechs | 99.8 /100 | #28 | Exceptional 9.2% |