Immigrants from Cabo Verde vs Immigrants from Morocco Receiving Food Stamps
COMPARE
Immigrants from Cabo Verde
Immigrants from Morocco
Receiving Food Stamps
Receiving Food Stamps Comparison
Immigrants from Cabo Verde
Immigrants from Morocco
23.8%
RECEIVING FOOD STAMPS
0.0/ 100
METRIC RATING
345th/ 347
METRIC RANK
11.9%
RECEIVING FOOD STAMPS
40.7/ 100
METRIC RATING
182nd/ 347
METRIC RANK
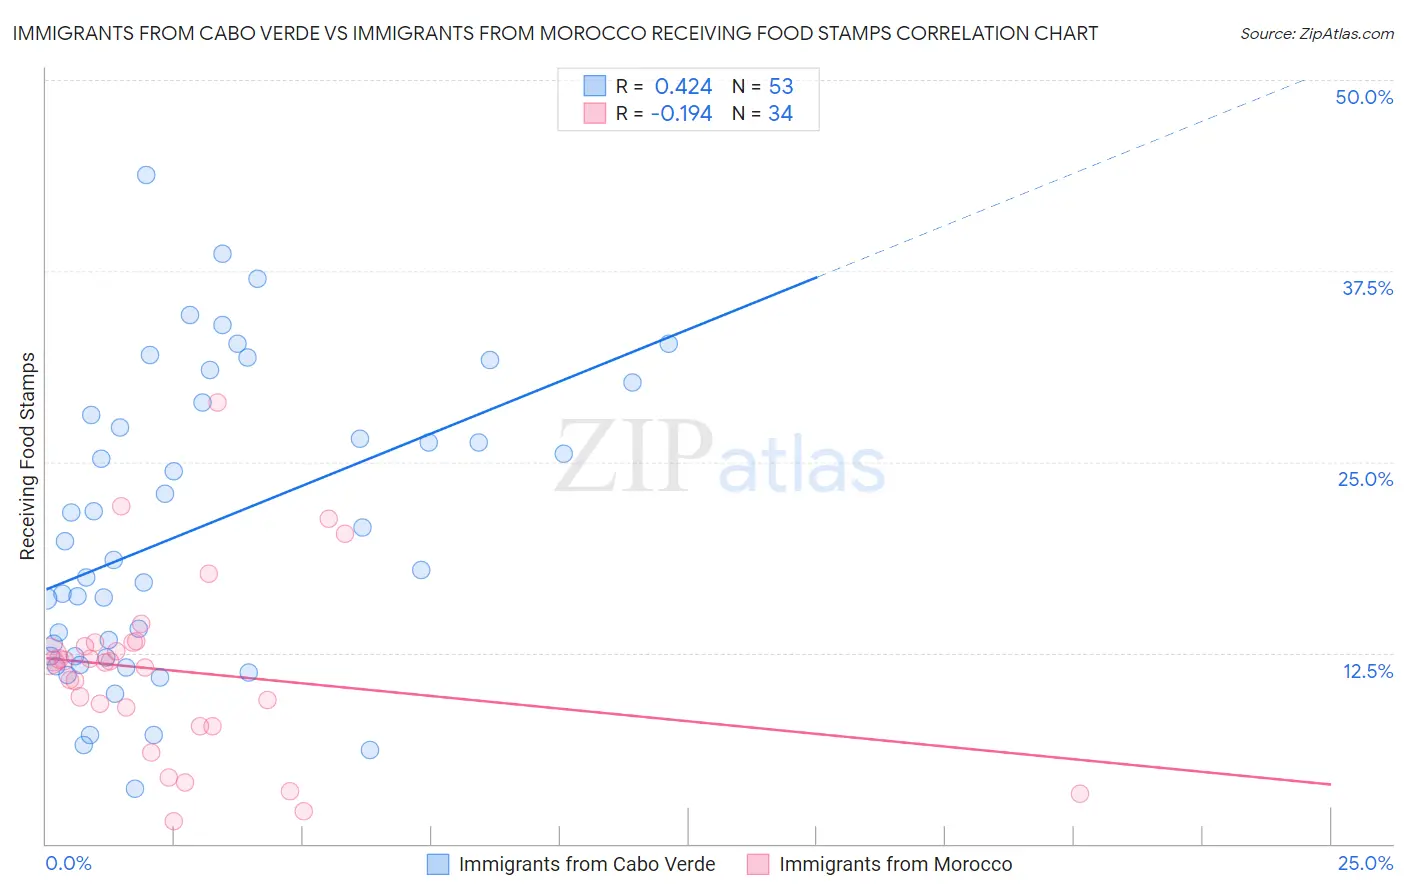
Immigrants from Cabo Verde vs Immigrants from Morocco Receiving Food Stamps Correlation Chart
The statistical analysis conducted on geographies consisting of 38,130,553 people shows a moderate positive correlation between the proportion of Immigrants from Cabo Verde and percentage of population receiving government assistance and/or food stamps in the United States with a correlation coefficient (R) of 0.424 and weighted average of 23.8%. Similarly, the statistical analysis conducted on geographies consisting of 178,818,675 people shows a poor negative correlation between the proportion of Immigrants from Morocco and percentage of population receiving government assistance and/or food stamps in the United States with a correlation coefficient (R) of -0.194 and weighted average of 11.9%, a difference of 100.5%.
Receiving Food Stamps Correlation Summary
| Measurement | Immigrants from Cabo Verde | Immigrants from Morocco |
| Minimum | 3.6% | 1.5% |
| Maximum | 43.8% | 28.9% |
| Range | 40.2% | 27.4% |
| Mean | 20.6% | 11.3% |
| Median | 18.6% | 11.9% |
| Interquartile 25% (IQ1) | 12.2% | 7.7% |
| Interquartile 75% (IQ3) | 28.5% | 13.1% |
| Interquartile Range (IQR) | 16.3% | 5.4% |
| Standard Deviation (Sample) | 9.7% | 5.9% |
| Standard Deviation (Population) | 9.6% | 5.8% |
Similar Demographics by Receiving Food Stamps
Demographics Similar to Immigrants from Cabo Verde by Receiving Food Stamps
In terms of receiving food stamps, the demographic groups most similar to Immigrants from Cabo Verde are Lumbee (22.9%, a difference of 4.1%), Immigrants from Dominican Republic (22.1%, a difference of 7.8%), Puerto Rican (26.0%, a difference of 8.9%), Immigrants from Yemen (21.6%, a difference of 10.2%), and Hopi (21.6%, a difference of 10.6%).
| Demographics | Rating | Rank | Receiving Food Stamps |
| Inupiat | 0.0 /100 | #333 | Tragic 20.1% |
| Yuman | 0.0 /100 | #334 | Tragic 20.2% |
| Immigrants | Cuba | 0.0 /100 | #335 | Tragic 20.8% |
| Navajo | 0.0 /100 | #336 | Tragic 21.1% |
| Cape Verdeans | 0.0 /100 | #337 | Tragic 21.1% |
| Dominicans | 0.0 /100 | #338 | Tragic 21.4% |
| Yakama | 0.0 /100 | #339 | Tragic 21.4% |
| Tohono O'odham | 0.0 /100 | #340 | Tragic 21.5% |
| Hopi | 0.0 /100 | #341 | Tragic 21.6% |
| Immigrants | Yemen | 0.0 /100 | #342 | Tragic 21.6% |
| Immigrants | Dominican Republic | 0.0 /100 | #343 | Tragic 22.1% |
| Lumbee | 0.0 /100 | #344 | Tragic 22.9% |
| Immigrants | Cabo Verde | 0.0 /100 | #345 | Tragic 23.8% |
| Puerto Ricans | 0.0 /100 | #346 | Tragic 26.0% |
| Yup'ik | 0.0 /100 | #347 | Tragic 32.7% |
Demographics Similar to Immigrants from Morocco by Receiving Food Stamps
In terms of receiving food stamps, the demographic groups most similar to Immigrants from Morocco are Immigrants from Uganda (11.9%, a difference of 0.060%), Spaniard (11.9%, a difference of 0.13%), South American Indian (11.9%, a difference of 0.15%), Immigrants from Iraq (12.0%, a difference of 0.52%), and Spanish (12.0%, a difference of 0.56%).
| Demographics | Rating | Rank | Receiving Food Stamps |
| Osage | 49.8 /100 | #175 | Average 11.7% |
| Peruvians | 49.3 /100 | #176 | Average 11.7% |
| Immigrants | Ukraine | 48.4 /100 | #177 | Average 11.8% |
| German Russians | 48.1 /100 | #178 | Average 11.8% |
| Immigrants | Kenya | 46.4 /100 | #179 | Average 11.8% |
| Uruguayans | 44.8 /100 | #180 | Average 11.8% |
| South American Indians | 41.7 /100 | #181 | Average 11.9% |
| Immigrants | Morocco | 40.7 /100 | #182 | Average 11.9% |
| Immigrants | Uganda | 40.3 /100 | #183 | Average 11.9% |
| Spaniards | 39.8 /100 | #184 | Fair 11.9% |
| Immigrants | Iraq | 37.1 /100 | #185 | Fair 12.0% |
| Spanish | 36.9 /100 | #186 | Fair 12.0% |
| Albanians | 35.4 /100 | #187 | Fair 12.0% |
| Sudanese | 33.4 /100 | #188 | Fair 12.0% |
| Immigrants | Cameroon | 32.5 /100 | #189 | Fair 12.0% |