Immigrants from North America vs Luxembourger Receiving Food Stamps
COMPARE
Immigrants from North America
Luxembourger
Receiving Food Stamps
Receiving Food Stamps Comparison
Immigrants from North America
Luxembourgers
9.8%
RECEIVING FOOD STAMPS
99.2/ 100
METRIC RATING
64th/ 347
METRIC RANK
9.1%
RECEIVING FOOD STAMPS
99.8/ 100
METRIC RATING
21st/ 347
METRIC RANK
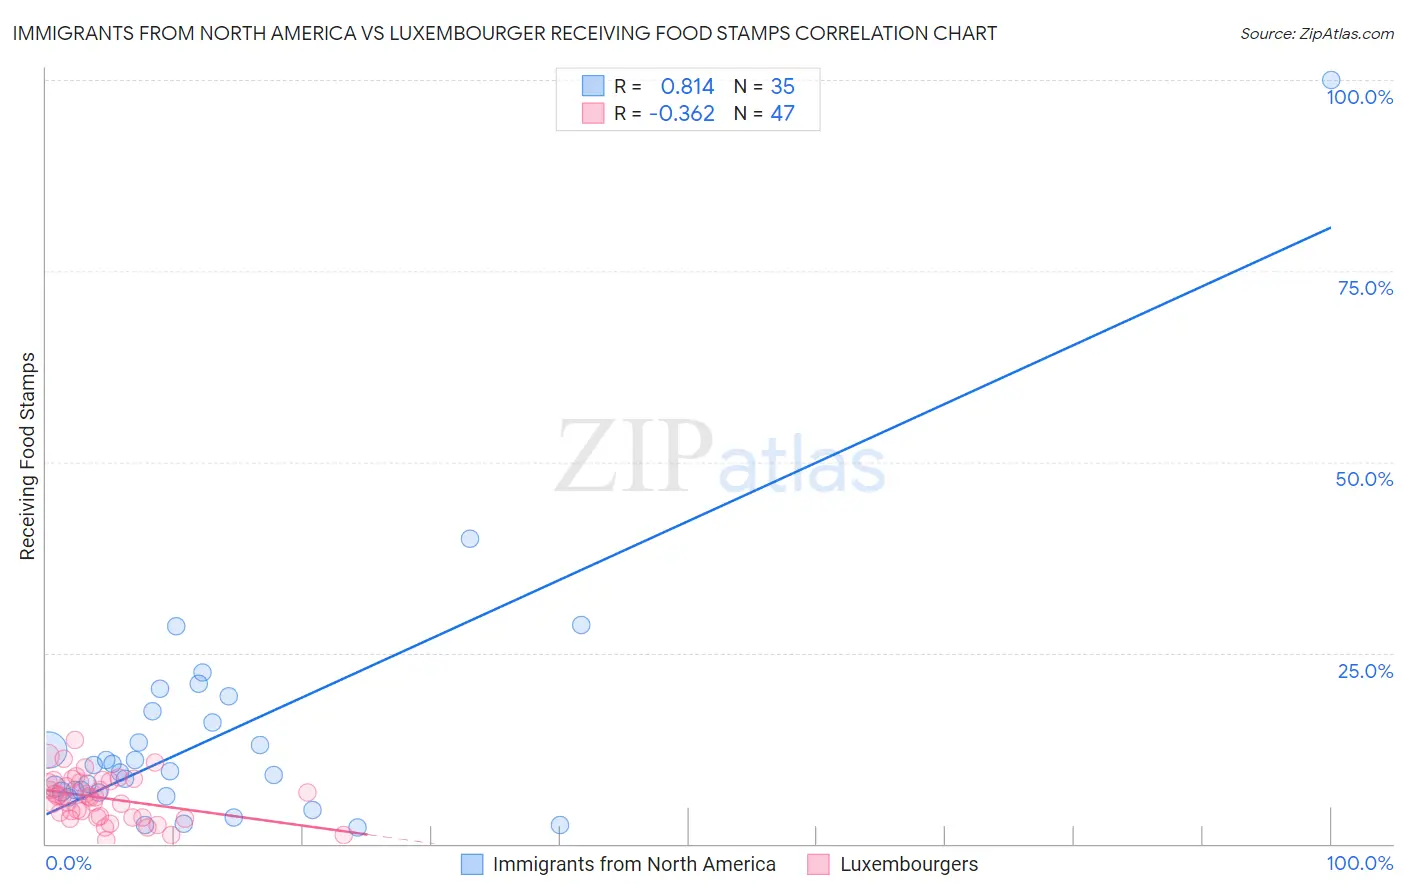
Immigrants from North America vs Luxembourger Receiving Food Stamps Correlation Chart
The statistical analysis conducted on geographies consisting of 460,673,345 people shows a very strong positive correlation between the proportion of Immigrants from North America and percentage of population receiving government assistance and/or food stamps in the United States with a correlation coefficient (R) of 0.814 and weighted average of 9.8%. Similarly, the statistical analysis conducted on geographies consisting of 144,526,649 people shows a mild negative correlation between the proportion of Luxembourgers and percentage of population receiving government assistance and/or food stamps in the United States with a correlation coefficient (R) of -0.362 and weighted average of 9.1%, a difference of 7.0%.
Receiving Food Stamps Correlation Summary
| Measurement | Immigrants from North America | Luxembourger |
| Minimum | 2.1% | 0.57% |
| Maximum | 100.0% | 13.6% |
| Range | 97.9% | 13.1% |
| Mean | 14.4% | 6.0% |
| Median | 9.6% | 6.2% |
| Interquartile 25% (IQ1) | 6.7% | 3.5% |
| Interquartile 75% (IQ3) | 17.4% | 8.2% |
| Interquartile Range (IQR) | 10.7% | 4.7% |
| Standard Deviation (Sample) | 17.1% | 2.9% |
| Standard Deviation (Population) | 16.9% | 2.9% |
Similar Demographics by Receiving Food Stamps
Demographics Similar to Immigrants from North America by Receiving Food Stamps
In terms of receiving food stamps, the demographic groups most similar to Immigrants from North America are Chinese (9.8%, a difference of 0.090%), Immigrants from Bulgaria (9.8%, a difference of 0.12%), Immigrants from Turkey (9.8%, a difference of 0.17%), English (9.8%, a difference of 0.19%), and German (9.7%, a difference of 0.34%).
| Demographics | Rating | Rank | Receiving Food Stamps |
| Greeks | 99.3 /100 | #57 | Exceptional 9.7% |
| Scandinavians | 99.2 /100 | #58 | Exceptional 9.7% |
| British | 99.2 /100 | #59 | Exceptional 9.7% |
| Germans | 99.2 /100 | #60 | Exceptional 9.7% |
| English | 99.2 /100 | #61 | Exceptional 9.8% |
| Immigrants | Bulgaria | 99.2 /100 | #62 | Exceptional 9.8% |
| Chinese | 99.2 /100 | #63 | Exceptional 9.8% |
| Immigrants | North America | 99.2 /100 | #64 | Exceptional 9.8% |
| Immigrants | Turkey | 99.1 /100 | #65 | Exceptional 9.8% |
| Slovenes | 99.1 /100 | #66 | Exceptional 9.8% |
| Immigrants | Indonesia | 99.0 /100 | #67 | Exceptional 9.8% |
| Northern Europeans | 99.0 /100 | #68 | Exceptional 9.8% |
| Italians | 99.0 /100 | #69 | Exceptional 9.9% |
| Immigrants | Serbia | 99.0 /100 | #70 | Exceptional 9.9% |
| Scottish | 98.9 /100 | #71 | Exceptional 9.9% |
Demographics Similar to Luxembourgers by Receiving Food Stamps
In terms of receiving food stamps, the demographic groups most similar to Luxembourgers are Latvian (9.1%, a difference of 0.15%), Immigrants from Australia (9.2%, a difference of 0.25%), Eastern European (9.2%, a difference of 0.36%), Immigrants from Northern Europe (9.2%, a difference of 0.38%), and Immigrants from Hong Kong (9.1%, a difference of 0.48%).
| Demographics | Rating | Rank | Receiving Food Stamps |
| Maltese | 99.9 /100 | #14 | Exceptional 8.9% |
| Norwegians | 99.9 /100 | #15 | Exceptional 9.0% |
| Immigrants | Japan | 99.9 /100 | #16 | Exceptional 9.0% |
| Immigrants | Scotland | 99.9 /100 | #17 | Exceptional 9.0% |
| Danes | 99.9 /100 | #18 | Exceptional 9.0% |
| Immigrants | Hong Kong | 99.8 /100 | #19 | Exceptional 9.1% |
| Latvians | 99.8 /100 | #20 | Exceptional 9.1% |
| Luxembourgers | 99.8 /100 | #21 | Exceptional 9.1% |
| Immigrants | Australia | 99.8 /100 | #22 | Exceptional 9.2% |
| Eastern Europeans | 99.8 /100 | #23 | Exceptional 9.2% |
| Immigrants | Northern Europe | 99.8 /100 | #24 | Exceptional 9.2% |
| Immigrants | Ireland | 99.8 /100 | #25 | Exceptional 9.2% |
| Swedes | 99.8 /100 | #26 | Exceptional 9.2% |
| Bhutanese | 99.8 /100 | #27 | Exceptional 9.2% |
| Czechs | 99.8 /100 | #28 | Exceptional 9.2% |