Immigrants from Cabo Verde vs Celtic Receiving Food Stamps
COMPARE
Immigrants from Cabo Verde
Celtic
Receiving Food Stamps
Receiving Food Stamps Comparison
Immigrants from Cabo Verde
Celtics
23.8%
RECEIVING FOOD STAMPS
0.0/ 100
METRIC RATING
345th/ 347
METRIC RANK
10.9%
RECEIVING FOOD STAMPS
87.8/ 100
METRIC RATING
140th/ 347
METRIC RANK
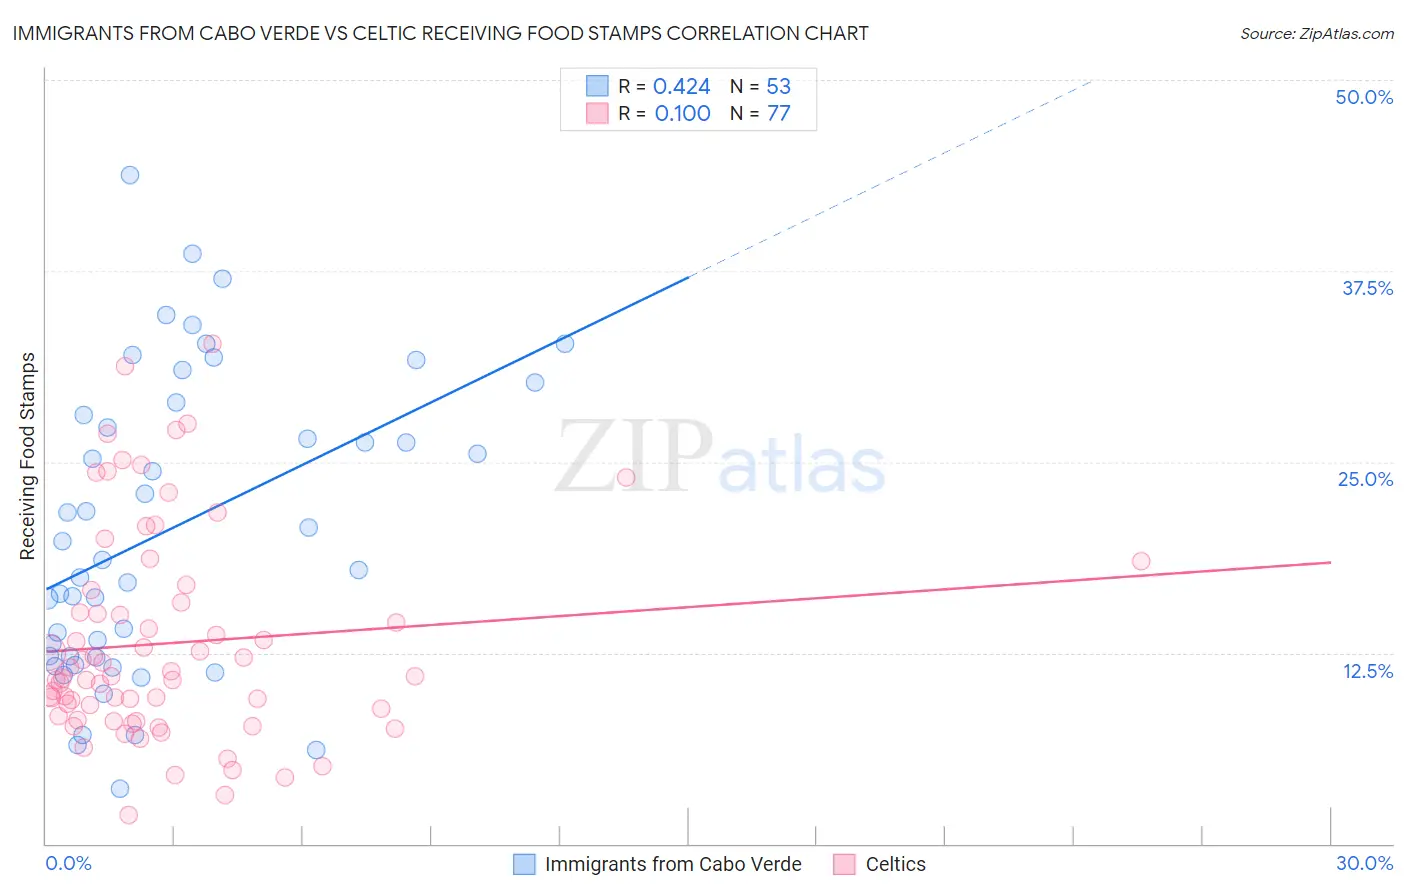
Immigrants from Cabo Verde vs Celtic Receiving Food Stamps Correlation Chart
The statistical analysis conducted on geographies consisting of 38,130,553 people shows a moderate positive correlation between the proportion of Immigrants from Cabo Verde and percentage of population receiving government assistance and/or food stamps in the United States with a correlation coefficient (R) of 0.424 and weighted average of 23.8%. Similarly, the statistical analysis conducted on geographies consisting of 168,687,125 people shows a slight positive correlation between the proportion of Celtics and percentage of population receiving government assistance and/or food stamps in the United States with a correlation coefficient (R) of 0.100 and weighted average of 10.9%, a difference of 118.2%.
Receiving Food Stamps Correlation Summary
| Measurement | Immigrants from Cabo Verde | Celtic |
| Minimum | 3.6% | 1.9% |
| Maximum | 43.8% | 32.7% |
| Range | 40.2% | 30.8% |
| Mean | 20.6% | 13.1% |
| Median | 18.6% | 11.0% |
| Interquartile 25% (IQ1) | 12.2% | 8.2% |
| Interquartile 75% (IQ3) | 28.5% | 16.2% |
| Interquartile Range (IQR) | 16.3% | 8.0% |
| Standard Deviation (Sample) | 9.7% | 6.9% |
| Standard Deviation (Population) | 9.6% | 6.8% |
Similar Demographics by Receiving Food Stamps
Demographics Similar to Immigrants from Cabo Verde by Receiving Food Stamps
In terms of receiving food stamps, the demographic groups most similar to Immigrants from Cabo Verde are Lumbee (22.9%, a difference of 4.1%), Immigrants from Dominican Republic (22.1%, a difference of 7.8%), Puerto Rican (26.0%, a difference of 8.9%), Immigrants from Yemen (21.6%, a difference of 10.2%), and Hopi (21.6%, a difference of 10.6%).
| Demographics | Rating | Rank | Receiving Food Stamps |
| Inupiat | 0.0 /100 | #333 | Tragic 20.1% |
| Yuman | 0.0 /100 | #334 | Tragic 20.2% |
| Immigrants | Cuba | 0.0 /100 | #335 | Tragic 20.8% |
| Navajo | 0.0 /100 | #336 | Tragic 21.1% |
| Cape Verdeans | 0.0 /100 | #337 | Tragic 21.1% |
| Dominicans | 0.0 /100 | #338 | Tragic 21.4% |
| Yakama | 0.0 /100 | #339 | Tragic 21.4% |
| Tohono O'odham | 0.0 /100 | #340 | Tragic 21.5% |
| Hopi | 0.0 /100 | #341 | Tragic 21.6% |
| Immigrants | Yemen | 0.0 /100 | #342 | Tragic 21.6% |
| Immigrants | Dominican Republic | 0.0 /100 | #343 | Tragic 22.1% |
| Lumbee | 0.0 /100 | #344 | Tragic 22.9% |
| Immigrants | Cabo Verde | 0.0 /100 | #345 | Tragic 23.8% |
| Puerto Ricans | 0.0 /100 | #346 | Tragic 26.0% |
| Yup'ik | 0.0 /100 | #347 | Tragic 32.7% |
Demographics Similar to Celtics by Receiving Food Stamps
In terms of receiving food stamps, the demographic groups most similar to Celtics are Hmong (10.9%, a difference of 0.20%), Immigrants from Moldova (10.9%, a difference of 0.24%), Immigrants from Vietnam (11.0%, a difference of 0.36%), Chilean (11.0%, a difference of 0.53%), and Immigrants from Northern Africa (11.0%, a difference of 0.61%).
| Demographics | Rating | Rank | Receiving Food Stamps |
| Immigrants | Russia | 90.9 /100 | #133 | Exceptional 10.8% |
| Immigrants | Brazil | 90.3 /100 | #134 | Exceptional 10.8% |
| Argentineans | 90.2 /100 | #135 | Exceptional 10.8% |
| Slovaks | 89.8 /100 | #136 | Excellent 10.8% |
| Immigrants | Eastern Europe | 89.8 /100 | #137 | Excellent 10.8% |
| Immigrants | Moldova | 88.5 /100 | #138 | Excellent 10.9% |
| Hmong | 88.4 /100 | #139 | Excellent 10.9% |
| Celtics | 87.8 /100 | #140 | Excellent 10.9% |
| Immigrants | Vietnam | 86.7 /100 | #141 | Excellent 11.0% |
| Chileans | 86.2 /100 | #142 | Excellent 11.0% |
| Immigrants | Northern Africa | 86.0 /100 | #143 | Excellent 11.0% |
| Syrians | 85.5 /100 | #144 | Excellent 11.0% |
| Hungarians | 85.1 /100 | #145 | Excellent 11.0% |
| Taiwanese | 84.2 /100 | #146 | Excellent 11.0% |
| Whites/Caucasians | 83.9 /100 | #147 | Excellent 11.1% |