Ugandan vs Luxembourger Receiving Food Stamps
COMPARE
Ugandan
Luxembourger
Receiving Food Stamps
Receiving Food Stamps Comparison
Ugandans
Luxembourgers
12.2%
RECEIVING FOOD STAMPS
22.5/ 100
METRIC RATING
201st/ 347
METRIC RANK
9.1%
RECEIVING FOOD STAMPS
99.8/ 100
METRIC RATING
21st/ 347
METRIC RANK
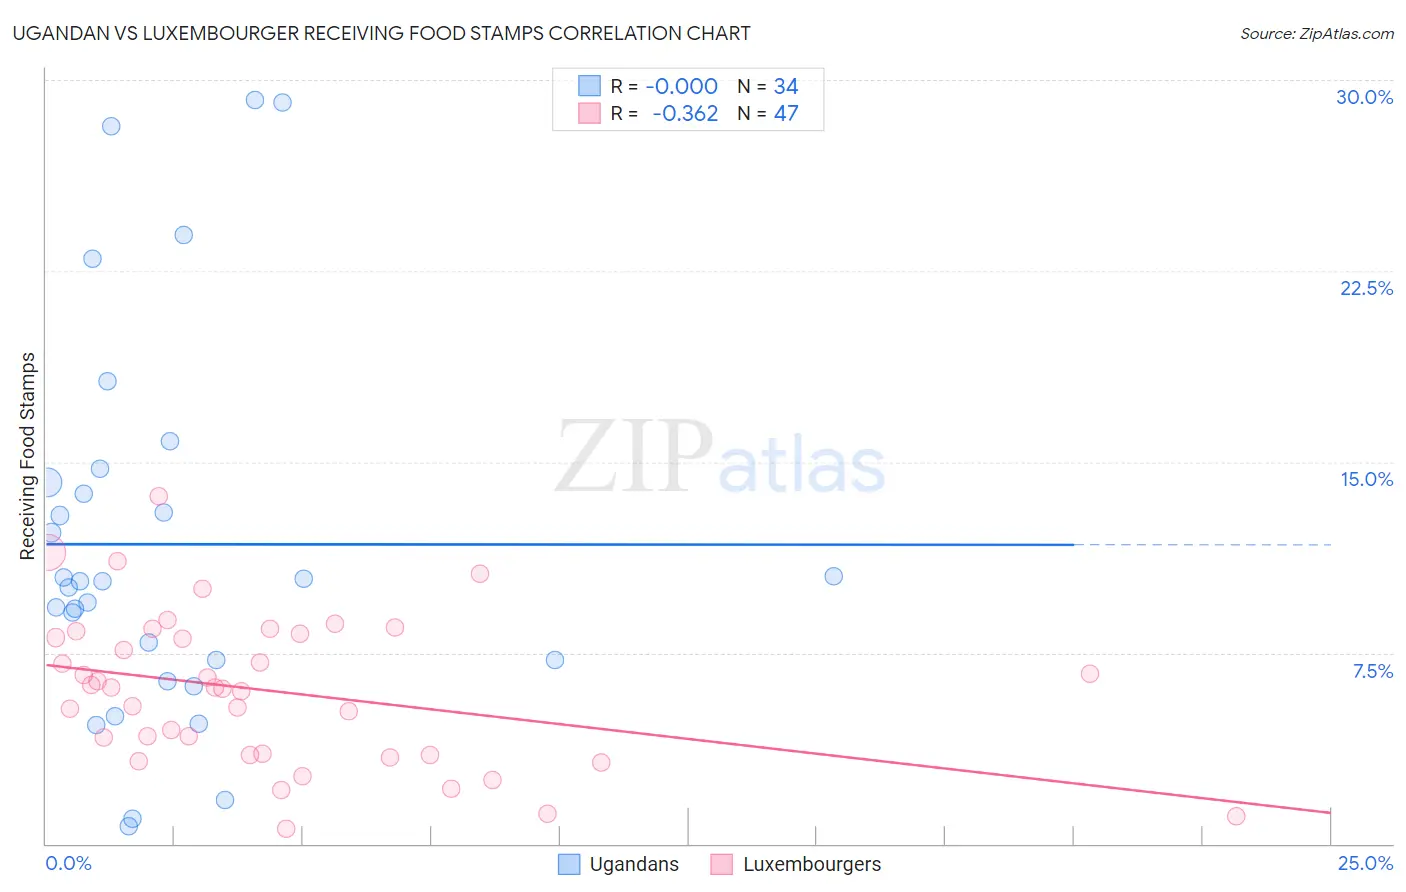
Ugandan vs Luxembourger Receiving Food Stamps Correlation Chart
The statistical analysis conducted on geographies consisting of 93,990,866 people shows no correlation between the proportion of Ugandans and percentage of population receiving government assistance and/or food stamps in the United States with a correlation coefficient (R) of -0.000 and weighted average of 12.2%. Similarly, the statistical analysis conducted on geographies consisting of 144,526,649 people shows a mild negative correlation between the proportion of Luxembourgers and percentage of population receiving government assistance and/or food stamps in the United States with a correlation coefficient (R) of -0.362 and weighted average of 9.1%, a difference of 34.1%.
Receiving Food Stamps Correlation Summary
| Measurement | Ugandan | Luxembourger |
| Minimum | 0.70% | 0.57% |
| Maximum | 29.2% | 13.6% |
| Range | 28.5% | 13.1% |
| Mean | 11.8% | 6.0% |
| Median | 10.3% | 6.2% |
| Interquartile 25% (IQ1) | 7.2% | 3.5% |
| Interquartile 75% (IQ3) | 14.2% | 8.2% |
| Interquartile Range (IQR) | 7.0% | 4.7% |
| Standard Deviation (Sample) | 7.5% | 2.9% |
| Standard Deviation (Population) | 7.4% | 2.9% |
Similar Demographics by Receiving Food Stamps
Demographics Similar to Ugandans by Receiving Food Stamps
In terms of receiving food stamps, the demographic groups most similar to Ugandans are Sierra Leonean (12.2%, a difference of 0.20%), Portuguese (12.2%, a difference of 0.48%), Immigrants from Venezuela (12.3%, a difference of 0.48%), Immigrants from Costa Rica (12.2%, a difference of 0.52%), and Delaware (12.2%, a difference of 0.66%).
| Demographics | Rating | Rank | Receiving Food Stamps |
| Immigrants | Sudan | 27.1 /100 | #194 | Fair 12.1% |
| Americans | 26.7 /100 | #195 | Fair 12.2% |
| Iraqis | 26.6 /100 | #196 | Fair 12.2% |
| Delaware | 26.1 /100 | #197 | Fair 12.2% |
| Immigrants | Costa Rica | 25.4 /100 | #198 | Fair 12.2% |
| Portuguese | 25.1 /100 | #199 | Fair 12.2% |
| Sierra Leoneans | 23.6 /100 | #200 | Fair 12.2% |
| Ugandans | 22.5 /100 | #201 | Fair 12.2% |
| Immigrants | Venezuela | 20.1 /100 | #202 | Fair 12.3% |
| Shoshone | 17.7 /100 | #203 | Poor 12.4% |
| Immigrants | Nonimmigrants | 17.6 /100 | #204 | Poor 12.4% |
| Aleuts | 17.3 /100 | #205 | Poor 12.4% |
| Immigrants | Thailand | 17.0 /100 | #206 | Poor 12.4% |
| South Americans | 16.0 /100 | #207 | Poor 12.4% |
| Potawatomi | 14.6 /100 | #208 | Poor 12.5% |
Demographics Similar to Luxembourgers by Receiving Food Stamps
In terms of receiving food stamps, the demographic groups most similar to Luxembourgers are Latvian (9.1%, a difference of 0.15%), Immigrants from Australia (9.2%, a difference of 0.25%), Eastern European (9.2%, a difference of 0.36%), Immigrants from Northern Europe (9.2%, a difference of 0.38%), and Immigrants from Hong Kong (9.1%, a difference of 0.48%).
| Demographics | Rating | Rank | Receiving Food Stamps |
| Maltese | 99.9 /100 | #14 | Exceptional 8.9% |
| Norwegians | 99.9 /100 | #15 | Exceptional 9.0% |
| Immigrants | Japan | 99.9 /100 | #16 | Exceptional 9.0% |
| Immigrants | Scotland | 99.9 /100 | #17 | Exceptional 9.0% |
| Danes | 99.9 /100 | #18 | Exceptional 9.0% |
| Immigrants | Hong Kong | 99.8 /100 | #19 | Exceptional 9.1% |
| Latvians | 99.8 /100 | #20 | Exceptional 9.1% |
| Luxembourgers | 99.8 /100 | #21 | Exceptional 9.1% |
| Immigrants | Australia | 99.8 /100 | #22 | Exceptional 9.2% |
| Eastern Europeans | 99.8 /100 | #23 | Exceptional 9.2% |
| Immigrants | Northern Europe | 99.8 /100 | #24 | Exceptional 9.2% |
| Immigrants | Ireland | 99.8 /100 | #25 | Exceptional 9.2% |
| Swedes | 99.8 /100 | #26 | Exceptional 9.2% |
| Bhutanese | 99.8 /100 | #27 | Exceptional 9.2% |
| Czechs | 99.8 /100 | #28 | Exceptional 9.2% |