Immigrants from Cabo Verde vs Austrian Receiving Food Stamps
COMPARE
Immigrants from Cabo Verde
Austrian
Receiving Food Stamps
Receiving Food Stamps Comparison
Immigrants from Cabo Verde
Austrians
23.8%
RECEIVING FOOD STAMPS
0.0/ 100
METRIC RATING
345th/ 347
METRIC RANK
10.0%
RECEIVING FOOD STAMPS
98.6/ 100
METRIC RATING
82nd/ 347
METRIC RANK
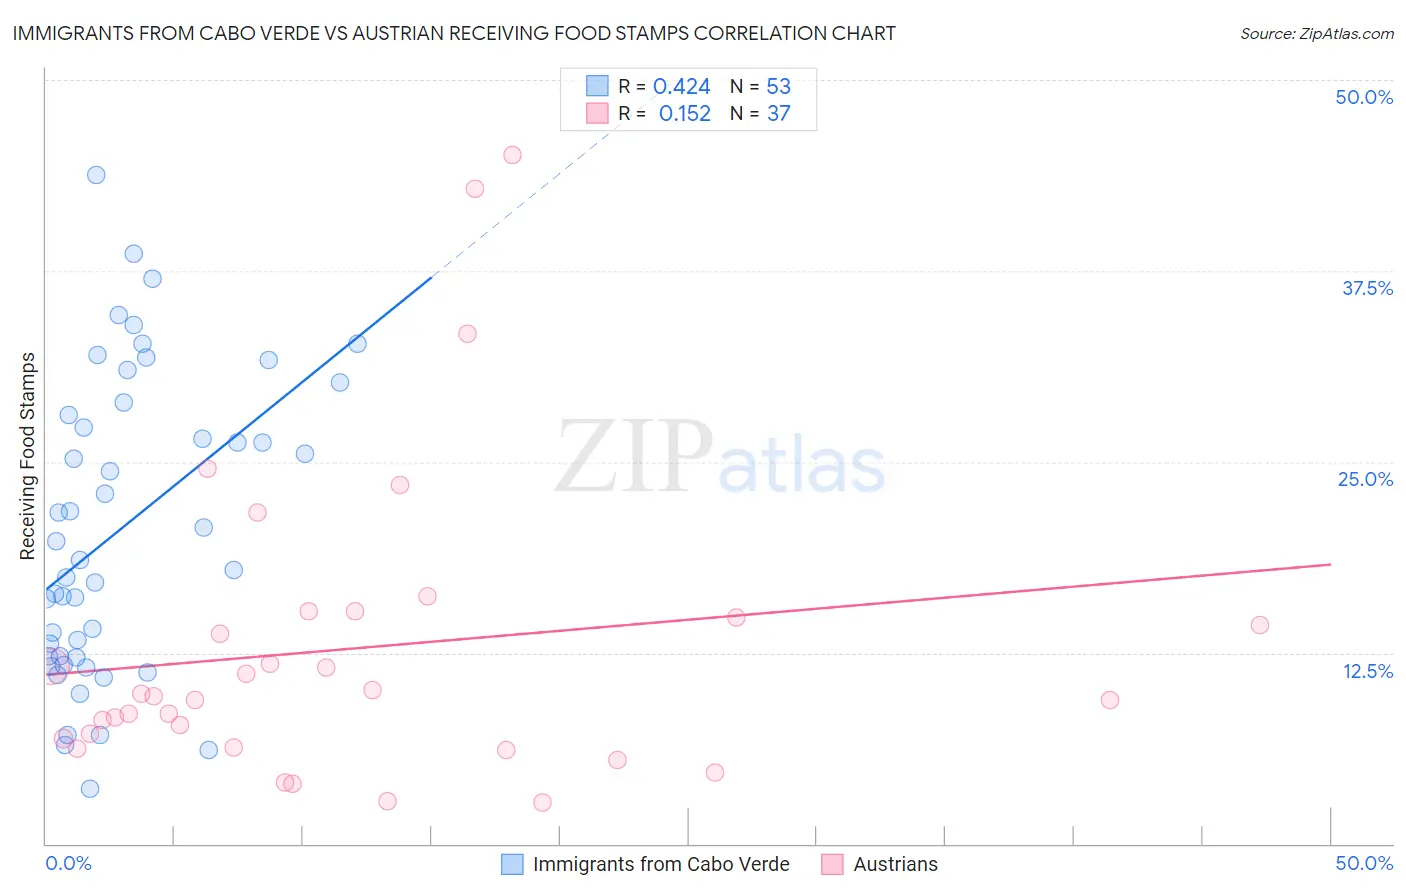
Immigrants from Cabo Verde vs Austrian Receiving Food Stamps Correlation Chart
The statistical analysis conducted on geographies consisting of 38,130,553 people shows a moderate positive correlation between the proportion of Immigrants from Cabo Verde and percentage of population receiving government assistance and/or food stamps in the United States with a correlation coefficient (R) of 0.424 and weighted average of 23.8%. Similarly, the statistical analysis conducted on geographies consisting of 450,225,937 people shows a poor positive correlation between the proportion of Austrians and percentage of population receiving government assistance and/or food stamps in the United States with a correlation coefficient (R) of 0.152 and weighted average of 10.0%, a difference of 138.4%.
Receiving Food Stamps Correlation Summary
| Measurement | Immigrants from Cabo Verde | Austrian |
| Minimum | 3.6% | 2.7% |
| Maximum | 43.8% | 45.1% |
| Range | 40.2% | 42.4% |
| Mean | 20.6% | 12.8% |
| Median | 18.6% | 9.7% |
| Interquartile 25% (IQ1) | 12.2% | 6.6% |
| Interquartile 75% (IQ3) | 28.5% | 15.0% |
| Interquartile Range (IQR) | 16.3% | 8.4% |
| Standard Deviation (Sample) | 9.7% | 10.0% |
| Standard Deviation (Population) | 9.6% | 9.8% |
Similar Demographics by Receiving Food Stamps
Demographics Similar to Immigrants from Cabo Verde by Receiving Food Stamps
In terms of receiving food stamps, the demographic groups most similar to Immigrants from Cabo Verde are Lumbee (22.9%, a difference of 4.1%), Immigrants from Dominican Republic (22.1%, a difference of 7.8%), Puerto Rican (26.0%, a difference of 8.9%), Immigrants from Yemen (21.6%, a difference of 10.2%), and Hopi (21.6%, a difference of 10.6%).
| Demographics | Rating | Rank | Receiving Food Stamps |
| Inupiat | 0.0 /100 | #333 | Tragic 20.1% |
| Yuman | 0.0 /100 | #334 | Tragic 20.2% |
| Immigrants | Cuba | 0.0 /100 | #335 | Tragic 20.8% |
| Navajo | 0.0 /100 | #336 | Tragic 21.1% |
| Cape Verdeans | 0.0 /100 | #337 | Tragic 21.1% |
| Dominicans | 0.0 /100 | #338 | Tragic 21.4% |
| Yakama | 0.0 /100 | #339 | Tragic 21.4% |
| Tohono O'odham | 0.0 /100 | #340 | Tragic 21.5% |
| Hopi | 0.0 /100 | #341 | Tragic 21.6% |
| Immigrants | Yemen | 0.0 /100 | #342 | Tragic 21.6% |
| Immigrants | Dominican Republic | 0.0 /100 | #343 | Tragic 22.1% |
| Lumbee | 0.0 /100 | #344 | Tragic 22.9% |
| Immigrants | Cabo Verde | 0.0 /100 | #345 | Tragic 23.8% |
| Puerto Ricans | 0.0 /100 | #346 | Tragic 26.0% |
| Yup'ik | 0.0 /100 | #347 | Tragic 32.7% |
Demographics Similar to Austrians by Receiving Food Stamps
In terms of receiving food stamps, the demographic groups most similar to Austrians are Dutch (10.0%, a difference of 0.0%), Immigrants from Israel (10.0%, a difference of 0.070%), Immigrants from England (10.0%, a difference of 0.13%), Immigrants from Romania (10.0%, a difference of 0.25%), and Polish (10.0%, a difference of 0.27%).
| Demographics | Rating | Rank | Receiving Food Stamps |
| Immigrants | Zimbabwe | 98.7 /100 | #75 | Exceptional 9.9% |
| Immigrants | Croatia | 98.7 /100 | #76 | Exceptional 10.0% |
| Immigrants | North Macedonia | 98.7 /100 | #77 | Exceptional 10.0% |
| South Africans | 98.7 /100 | #78 | Exceptional 10.0% |
| Laotians | 98.7 /100 | #79 | Exceptional 10.0% |
| Poles | 98.6 /100 | #80 | Exceptional 10.0% |
| Immigrants | England | 98.6 /100 | #81 | Exceptional 10.0% |
| Austrians | 98.6 /100 | #82 | Exceptional 10.0% |
| Dutch | 98.6 /100 | #83 | Exceptional 10.0% |
| Immigrants | Israel | 98.5 /100 | #84 | Exceptional 10.0% |
| Immigrants | Romania | 98.5 /100 | #85 | Exceptional 10.0% |
| Immigrants | Norway | 98.4 /100 | #86 | Exceptional 10.0% |
| Egyptians | 98.4 /100 | #87 | Exceptional 10.0% |
| Immigrants | Kuwait | 98.4 /100 | #88 | Exceptional 10.0% |
| Immigrants | France | 98.3 /100 | #89 | Exceptional 10.1% |