Immigrants from Cabo Verde vs Immigrants from Uzbekistan Child Poverty Under the Age of 5
COMPARE
Immigrants from Cabo Verde
Immigrants from Uzbekistan
Child Poverty Under the Age of 5
Child Poverty Under the Age of 5 Comparison
Immigrants from Cabo Verde
Immigrants from Uzbekistan
19.5%
CHILD POVERTY UNDER THE AGE OF 5
0.6/ 100
METRIC RATING
237th/ 347
METRIC RANK
17.0%
CHILD POVERTY UNDER THE AGE OF 5
62.0/ 100
METRIC RATING
167th/ 347
METRIC RANK
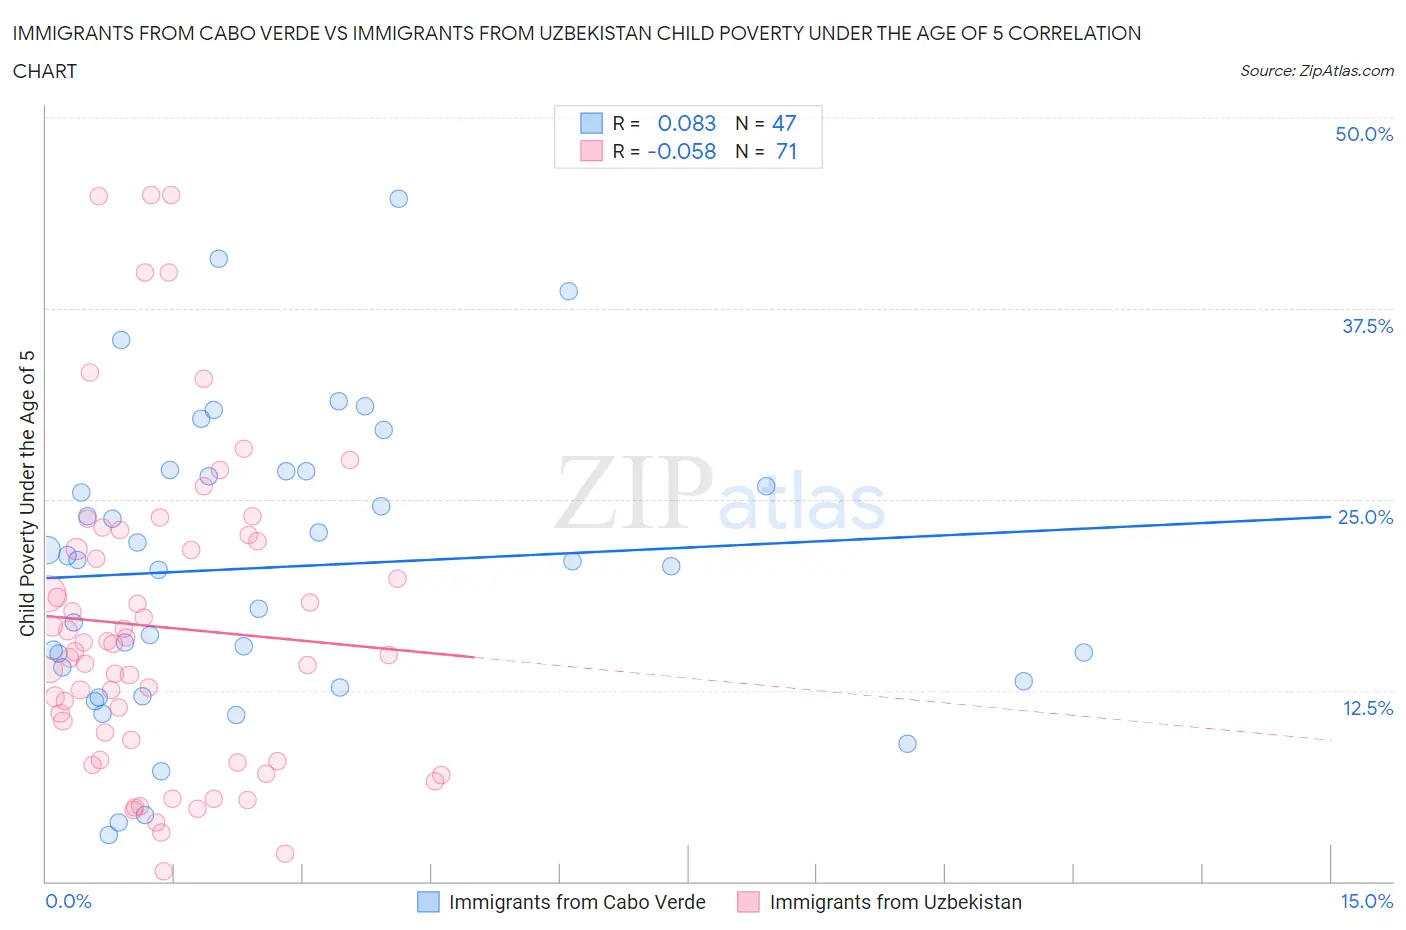
Immigrants from Cabo Verde vs Immigrants from Uzbekistan Child Poverty Under the Age of 5 Correlation Chart
The statistical analysis conducted on geographies consisting of 37,664,578 people shows a slight positive correlation between the proportion of Immigrants from Cabo Verde and poverty level among children under the age of 5 in the United States with a correlation coefficient (R) of 0.083 and weighted average of 19.5%. Similarly, the statistical analysis conducted on geographies consisting of 116,390,031 people shows a slight negative correlation between the proportion of Immigrants from Uzbekistan and poverty level among children under the age of 5 in the United States with a correlation coefficient (R) of -0.058 and weighted average of 17.0%, a difference of 14.6%.
Child Poverty Under the Age of 5 Correlation Summary
| Measurement | Immigrants from Cabo Verde | Immigrants from Uzbekistan |
| Minimum | 3.0% | 0.67% |
| Maximum | 44.7% | 44.9% |
| Range | 41.6% | 44.3% |
| Mean | 20.6% | 16.6% |
| Median | 21.0% | 15.0% |
| Interquartile 25% (IQ1) | 13.1% | 7.9% |
| Interquartile 75% (IQ3) | 26.8% | 22.3% |
| Interquartile Range (IQR) | 13.8% | 14.4% |
| Standard Deviation (Sample) | 9.6% | 10.4% |
| Standard Deviation (Population) | 9.5% | 10.3% |
Similar Demographics by Child Poverty Under the Age of 5
Demographics Similar to Immigrants from Cabo Verde by Child Poverty Under the Age of 5
In terms of child poverty under the age of 5, the demographic groups most similar to Immigrants from Cabo Verde are Salvadoran (19.5%, a difference of 0.010%), Vietnamese (19.5%, a difference of 0.040%), Immigrants from Ecuador (19.6%, a difference of 0.41%), Alaska Native (19.6%, a difference of 0.48%), and Immigrants from Trinidad and Tobago (19.4%, a difference of 0.55%).
| Demographics | Rating | Rank | Child Poverty Under the Age of 5 |
| Ecuadorians | 1.2 /100 | #230 | Tragic 19.2% |
| Bermudans | 1.2 /100 | #231 | Tragic 19.2% |
| Trinidadians and Tobagonians | 0.9 /100 | #232 | Tragic 19.3% |
| Sudanese | 0.9 /100 | #233 | Tragic 19.3% |
| Immigrants | Micronesia | 0.9 /100 | #234 | Tragic 19.4% |
| Immigrants | Laos | 0.8 /100 | #235 | Tragic 19.4% |
| Immigrants | Trinidad and Tobago | 0.8 /100 | #236 | Tragic 19.4% |
| Immigrants | Cabo Verde | 0.6 /100 | #237 | Tragic 19.5% |
| Salvadorans | 0.6 /100 | #238 | Tragic 19.5% |
| Vietnamese | 0.6 /100 | #239 | Tragic 19.5% |
| Immigrants | Ecuador | 0.5 /100 | #240 | Tragic 19.6% |
| Alaska Natives | 0.5 /100 | #241 | Tragic 19.6% |
| Immigrants | Guyana | 0.5 /100 | #242 | Tragic 19.6% |
| Osage | 0.5 /100 | #243 | Tragic 19.6% |
| Immigrants | Ghana | 0.5 /100 | #244 | Tragic 19.6% |
Demographics Similar to Immigrants from Uzbekistan by Child Poverty Under the Age of 5
In terms of child poverty under the age of 5, the demographic groups most similar to Immigrants from Uzbekistan are Uruguayan (17.0%, a difference of 0.16%), Immigrants from South America (17.1%, a difference of 0.21%), Slavic (17.0%, a difference of 0.22%), Immigrants from Western Asia (17.1%, a difference of 0.30%), and Immigrants from Morocco (17.1%, a difference of 0.33%).
| Demographics | Rating | Rank | Child Poverty Under the Age of 5 |
| Irish | 72.0 /100 | #160 | Good 16.8% |
| English | 70.4 /100 | #161 | Good 16.8% |
| Costa Ricans | 69.8 /100 | #162 | Good 16.9% |
| Scottish | 68.6 /100 | #163 | Good 16.9% |
| Immigrants | Oceania | 67.6 /100 | #164 | Good 16.9% |
| Immigrants | Colombia | 66.9 /100 | #165 | Good 16.9% |
| Slavs | 64.0 /100 | #166 | Good 17.0% |
| Immigrants | Uzbekistan | 62.0 /100 | #167 | Good 17.0% |
| Uruguayans | 60.5 /100 | #168 | Good 17.0% |
| Immigrants | South America | 60.0 /100 | #169 | Good 17.1% |
| Immigrants | Western Asia | 59.2 /100 | #170 | Average 17.1% |
| Immigrants | Morocco | 58.9 /100 | #171 | Average 17.1% |
| Yugoslavians | 54.1 /100 | #172 | Average 17.2% |
| Welsh | 54.0 /100 | #173 | Average 17.2% |
| Immigrants | Saudi Arabia | 50.0 /100 | #174 | Average 17.2% |