Israeli vs British West Indian Female Poverty
COMPARE
Israeli
British West Indian
Female Poverty
Female Poverty Comparison
Israelis
British West Indians
13.5%
FEMALE POVERTY
49.1/ 100
METRIC RATING
178th/ 347
METRIC RANK
17.0%
FEMALE POVERTY
0.0/ 100
METRIC RATING
313th/ 347
METRIC RANK
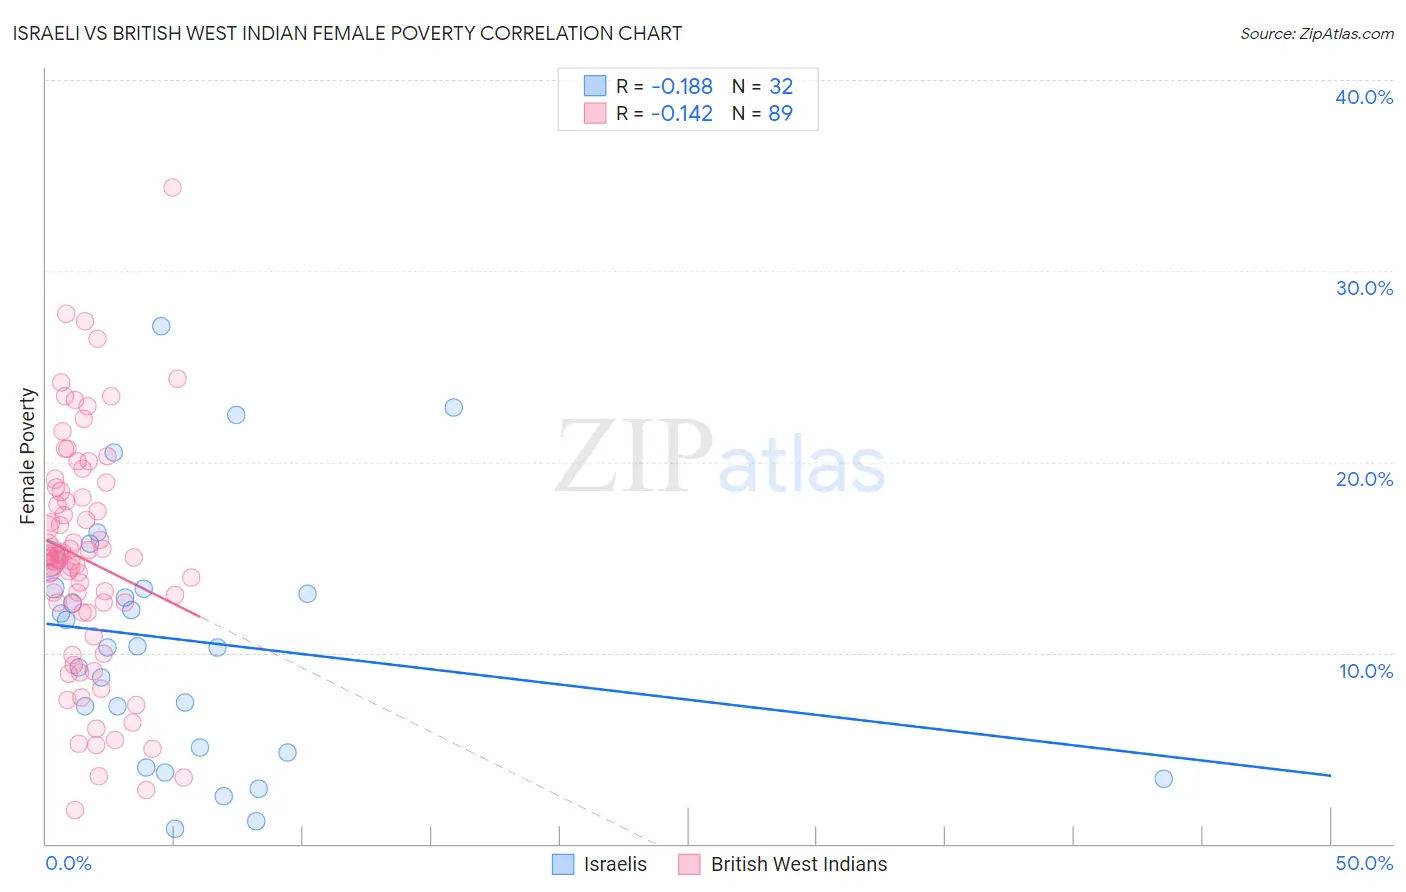
Israeli vs British West Indian Female Poverty Correlation Chart
The statistical analysis conducted on geographies consisting of 211,005,124 people shows a poor negative correlation between the proportion of Israelis and poverty level among females in the United States with a correlation coefficient (R) of -0.188 and weighted average of 13.5%. Similarly, the statistical analysis conducted on geographies consisting of 152,611,621 people shows a poor negative correlation between the proportion of British West Indians and poverty level among females in the United States with a correlation coefficient (R) of -0.142 and weighted average of 17.0%, a difference of 26.6%.
Female Poverty Correlation Summary
| Measurement | Israeli | British West Indian |
| Minimum | 0.76% | 1.8% |
| Maximum | 27.1% | 34.4% |
| Range | 26.4% | 32.6% |
| Mean | 10.6% | 14.9% |
| Median | 10.3% | 15.0% |
| Interquartile 25% (IQ1) | 4.9% | 12.1% |
| Interquartile 75% (IQ3) | 13.4% | 18.3% |
| Interquartile Range (IQR) | 8.5% | 6.2% |
| Standard Deviation (Sample) | 6.6% | 6.1% |
| Standard Deviation (Population) | 6.5% | 6.0% |
Similar Demographics by Female Poverty
Demographics Similar to Israelis by Female Poverty
In terms of female poverty, the demographic groups most similar to Israelis are Immigrants from Morocco (13.4%, a difference of 0.030%), Immigrants from Syria (13.5%, a difference of 0.030%), Celtic (13.4%, a difference of 0.080%), Immigrants from Spain (13.4%, a difference of 0.080%), and Immigrants from Iraq (13.4%, a difference of 0.090%).
| Demographics | Rating | Rank | Female Poverty |
| Whites/Caucasians | 54.6 /100 | #171 | Average 13.4% |
| Mongolians | 53.6 /100 | #172 | Average 13.4% |
| Immigrants | Afghanistan | 50.8 /100 | #173 | Average 13.4% |
| Immigrants | Iraq | 50.0 /100 | #174 | Average 13.4% |
| Celtics | 49.9 /100 | #175 | Average 13.4% |
| Immigrants | Spain | 49.9 /100 | #176 | Average 13.4% |
| Immigrants | Morocco | 49.4 /100 | #177 | Average 13.4% |
| Israelis | 49.1 /100 | #178 | Average 13.5% |
| Immigrants | Syria | 48.8 /100 | #179 | Average 13.5% |
| South Americans | 44.8 /100 | #180 | Average 13.5% |
| Venezuelans | 44.5 /100 | #181 | Average 13.5% |
| Immigrants | Colombia | 44.5 /100 | #182 | Average 13.5% |
| Kenyans | 43.8 /100 | #183 | Average 13.5% |
| Immigrants | Sierra Leone | 43.2 /100 | #184 | Average 13.5% |
| Immigrants | Cameroon | 42.0 /100 | #185 | Average 13.5% |
Demographics Similar to British West Indians by Female Poverty
In terms of female poverty, the demographic groups most similar to British West Indians are Immigrants from Somalia (17.0%, a difference of 0.080%), Creek (17.0%, a difference of 0.17%), Immigrants from Guatemala (17.0%, a difference of 0.17%), Dutch West Indian (17.1%, a difference of 0.25%), and Immigrants from Mexico (17.0%, a difference of 0.41%).
| Demographics | Rating | Rank | Female Poverty |
| Immigrants | Caribbean | 0.0 /100 | #306 | Tragic 16.9% |
| Seminole | 0.0 /100 | #307 | Tragic 16.9% |
| Africans | 0.0 /100 | #308 | Tragic 16.9% |
| Immigrants | Mexico | 0.0 /100 | #309 | Tragic 17.0% |
| Creek | 0.0 /100 | #310 | Tragic 17.0% |
| Immigrants | Guatemala | 0.0 /100 | #311 | Tragic 17.0% |
| Immigrants | Somalia | 0.0 /100 | #312 | Tragic 17.0% |
| British West Indians | 0.0 /100 | #313 | Tragic 17.0% |
| Dutch West Indians | 0.0 /100 | #314 | Tragic 17.1% |
| U.S. Virgin Islanders | 0.0 /100 | #315 | Tragic 17.3% |
| Hondurans | 0.0 /100 | #316 | Tragic 17.4% |
| Immigrants | Congo | 0.0 /100 | #317 | Tragic 17.4% |
| Ute | 0.0 /100 | #318 | Tragic 17.5% |
| Cajuns | 0.0 /100 | #319 | Tragic 17.5% |
| Immigrants | Dominica | 0.0 /100 | #320 | Tragic 17.5% |