Immigrants from Bulgaria vs British West Indian Male Disability
COMPARE
Immigrants from Bulgaria
British West Indian
Male Disability
Male Disability Comparison
Immigrants from Bulgaria
British West Indians
10.5%
MALE DISABILITY
99.1/ 100
METRIC RATING
70th/ 347
METRIC RANK
11.1%
MALE DISABILITY
62.8/ 100
METRIC RATING
164th/ 347
METRIC RANK
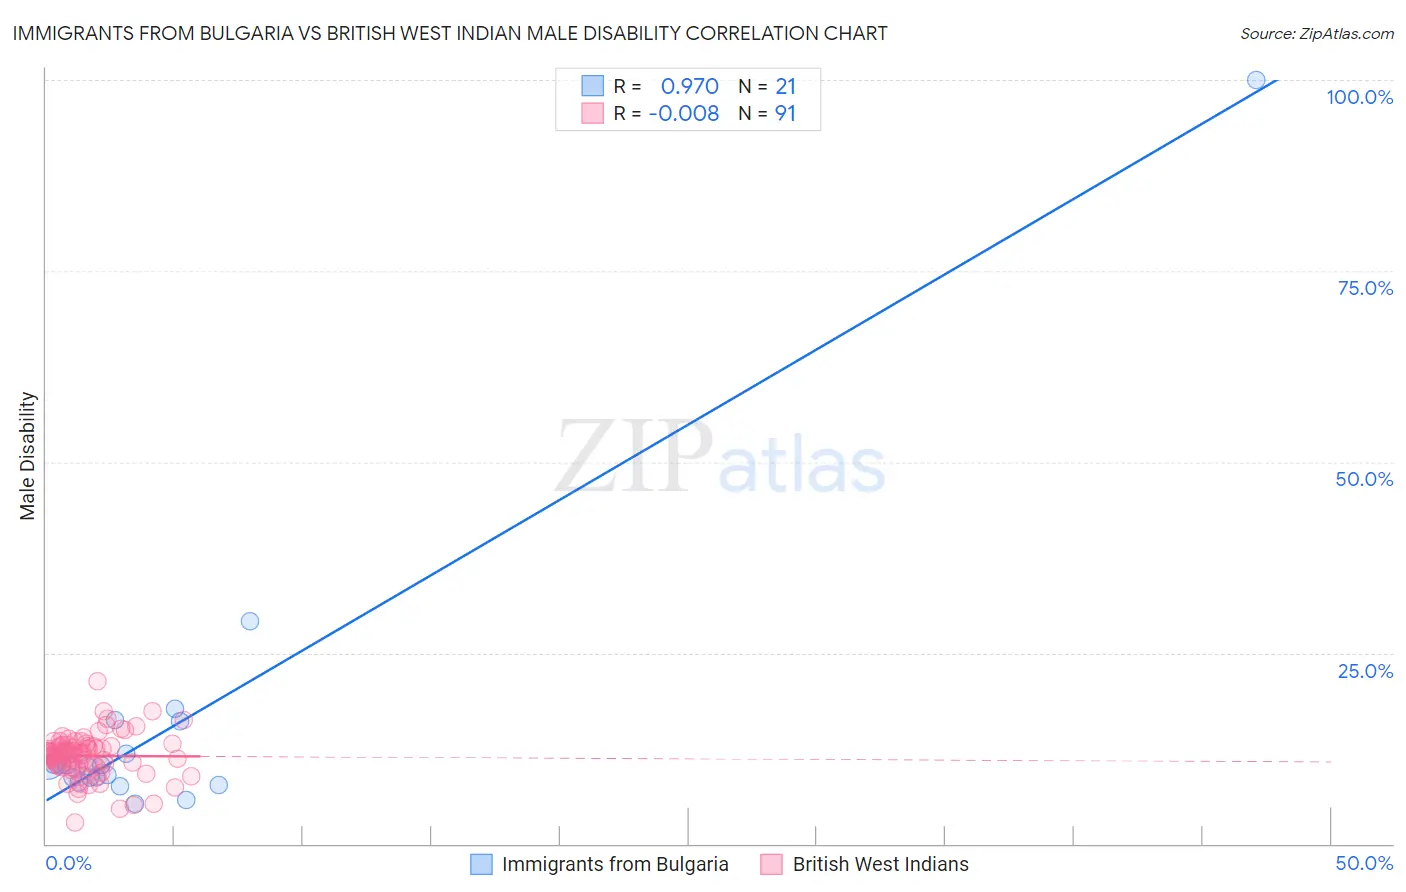
Immigrants from Bulgaria vs British West Indian Male Disability Correlation Chart
The statistical analysis conducted on geographies consisting of 172,550,350 people shows a perfect positive correlation between the proportion of Immigrants from Bulgaria and percentage of males with a disability in the United States with a correlation coefficient (R) of 0.970 and weighted average of 10.5%. Similarly, the statistical analysis conducted on geographies consisting of 152,682,334 people shows no correlation between the proportion of British West Indians and percentage of males with a disability in the United States with a correlation coefficient (R) of -0.008 and weighted average of 11.1%, a difference of 6.2%.
Male Disability Correlation Summary
| Measurement | Immigrants from Bulgaria | British West Indian |
| Minimum | 5.2% | 2.8% |
| Maximum | 100.0% | 21.3% |
| Range | 94.8% | 18.5% |
| Mean | 15.4% | 11.5% |
| Median | 10.3% | 11.7% |
| Interquartile 25% (IQ1) | 8.3% | 10.2% |
| Interquartile 75% (IQ3) | 14.0% | 12.8% |
| Interquartile Range (IQR) | 5.7% | 2.6% |
| Standard Deviation (Sample) | 20.1% | 2.8% |
| Standard Deviation (Population) | 19.6% | 2.8% |
Similar Demographics by Male Disability
Demographics Similar to Immigrants from Bulgaria by Male Disability
In terms of male disability, the demographic groups most similar to Immigrants from Bulgaria are Colombian (10.5%, a difference of 0.14%), Ecuadorian (10.5%, a difference of 0.14%), Immigrants from Cameroon (10.5%, a difference of 0.15%), Immigrants from Serbia (10.5%, a difference of 0.20%), and Immigrants from Afghanistan (10.5%, a difference of 0.24%).
| Demographics | Rating | Rank | Male Disability |
| Immigrants | Belarus | 99.3 /100 | #63 | Exceptional 10.4% |
| Jordanians | 99.3 /100 | #64 | Exceptional 10.5% |
| Immigrants | Grenada | 99.2 /100 | #65 | Exceptional 10.5% |
| Guyanese | 99.2 /100 | #66 | Exceptional 10.5% |
| Immigrants | Afghanistan | 99.2 /100 | #67 | Exceptional 10.5% |
| Colombians | 99.2 /100 | #68 | Exceptional 10.5% |
| Ecuadorians | 99.2 /100 | #69 | Exceptional 10.5% |
| Immigrants | Bulgaria | 99.1 /100 | #70 | Exceptional 10.5% |
| Immigrants | Cameroon | 99.0 /100 | #71 | Exceptional 10.5% |
| Immigrants | Serbia | 99.0 /100 | #72 | Exceptional 10.5% |
| Immigrants | Lithuania | 98.9 /100 | #73 | Exceptional 10.5% |
| Immigrants | Lebanon | 98.8 /100 | #74 | Exceptional 10.5% |
| Sierra Leoneans | 98.7 /100 | #75 | Exceptional 10.5% |
| Immigrants | Sierra Leone | 98.7 /100 | #76 | Exceptional 10.5% |
| Laotians | 98.6 /100 | #77 | Exceptional 10.6% |
Demographics Similar to British West Indians by Male Disability
In terms of male disability, the demographic groups most similar to British West Indians are Luxembourger (11.1%, a difference of 0.050%), Immigrants from Kenya (11.1%, a difference of 0.060%), Immigrants from Hungary (11.1%, a difference of 0.090%), Immigrants from Haiti (11.1%, a difference of 0.15%), and Immigrants from West Indies (11.1%, a difference of 0.18%).
| Demographics | Rating | Rank | Male Disability |
| Immigrants | Western Africa | 69.2 /100 | #157 | Good 11.1% |
| Latvians | 68.1 /100 | #158 | Good 11.1% |
| Guatemalans | 67.2 /100 | #159 | Good 11.1% |
| Albanians | 66.5 /100 | #160 | Good 11.1% |
| Immigrants | West Indies | 65.7 /100 | #161 | Good 11.1% |
| Immigrants | Haiti | 65.3 /100 | #162 | Good 11.1% |
| Immigrants | Kenya | 63.8 /100 | #163 | Good 11.1% |
| British West Indians | 62.8 /100 | #164 | Good 11.1% |
| Luxembourgers | 61.9 /100 | #165 | Good 11.1% |
| Immigrants | Hungary | 61.2 /100 | #166 | Good 11.1% |
| Immigrants | Southern Europe | 54.4 /100 | #167 | Average 11.2% |
| Immigrants | Latin America | 54.0 /100 | #168 | Average 11.2% |
| Barbadians | 53.4 /100 | #169 | Average 11.2% |
| New Zealanders | 52.9 /100 | #170 | Average 11.2% |
| Haitians | 52.5 /100 | #171 | Average 11.2% |