African vs Cheyenne Poverty
COMPARE
African
Cheyenne
Poverty
Poverty Comparison
Africans
Cheyenne
15.6%
POVERTY
0.0/ 100
METRIC RATING
307th/ 347
METRIC RANK
18.9%
POVERTY
0.0/ 100
METRIC RATING
335th/ 347
METRIC RANK
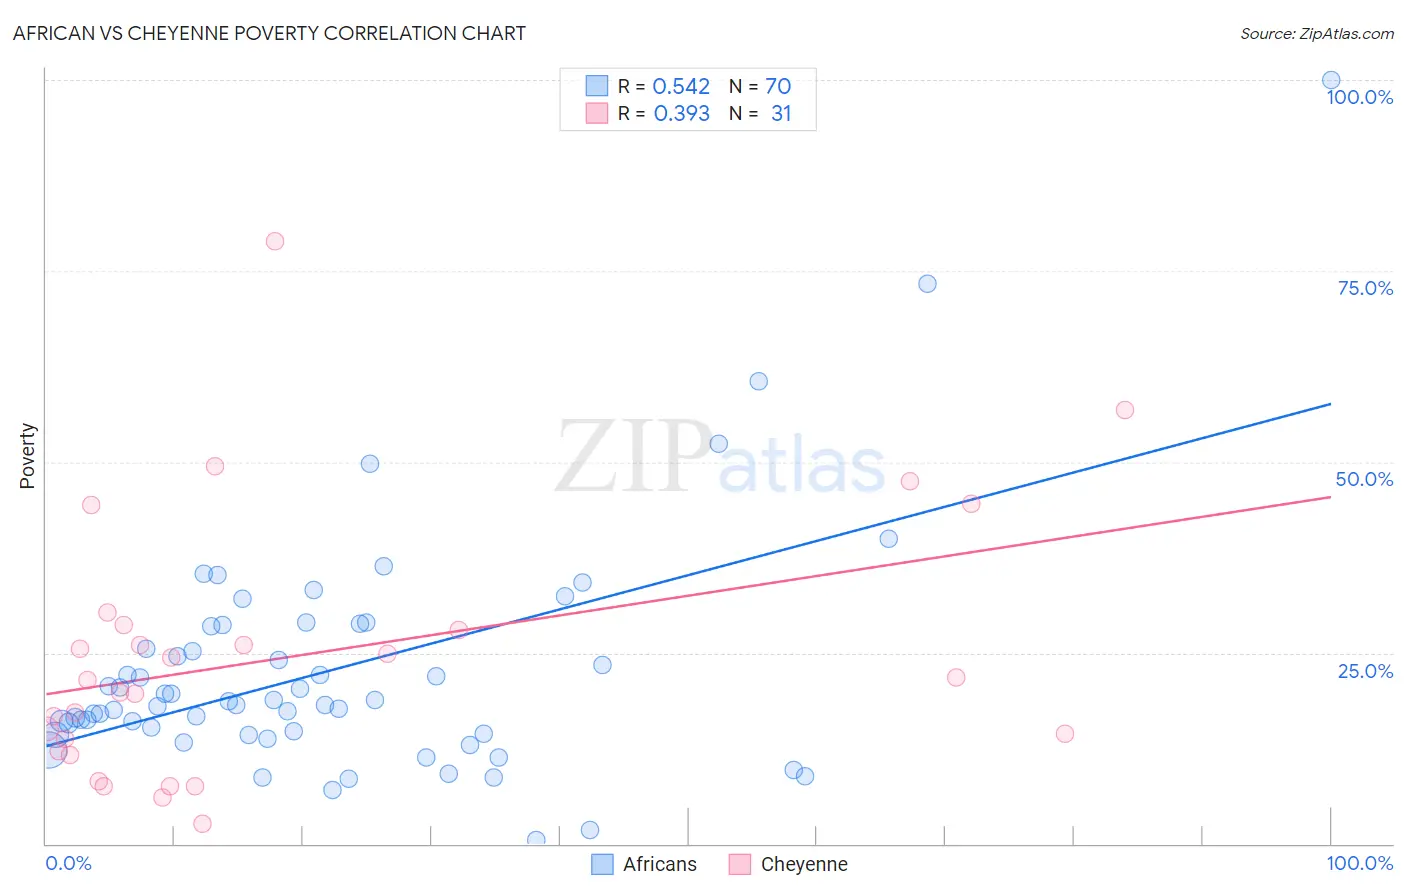
African vs Cheyenne Poverty Correlation Chart
The statistical analysis conducted on geographies consisting of 469,617,855 people shows a substantial positive correlation between the proportion of Africans and poverty level in the United States with a correlation coefficient (R) of 0.542 and weighted average of 15.6%. Similarly, the statistical analysis conducted on geographies consisting of 80,711,437 people shows a mild positive correlation between the proportion of Cheyenne and poverty level in the United States with a correlation coefficient (R) of 0.393 and weighted average of 18.9%, a difference of 21.5%.
Poverty Correlation Summary
| Measurement | African | Cheyenne |
| Minimum | 0.57% | 2.7% |
| Maximum | 100.0% | 78.9% |
| Range | 99.4% | 76.3% |
| Mean | 22.7% | 24.5% |
| Median | 18.4% | 21.4% |
| Interquartile 25% (IQ1) | 14.4% | 12.2% |
| Interquartile 75% (IQ3) | 28.5% | 28.6% |
| Interquartile Range (IQR) | 14.0% | 16.5% |
| Standard Deviation (Sample) | 15.6% | 17.1% |
| Standard Deviation (Population) | 15.5% | 16.8% |
Similar Demographics by Poverty
Demographics Similar to Africans by Poverty
In terms of poverty, the demographic groups most similar to Africans are Creek (15.6%, a difference of 0.070%), Choctaw (15.6%, a difference of 0.11%), Seminole (15.6%, a difference of 0.15%), Dutch West Indian (15.6%, a difference of 0.24%), and Immigrants from Guatemala (15.5%, a difference of 0.51%).
| Demographics | Rating | Rank | Poverty |
| Immigrants | Central America | 0.0 /100 | #300 | Tragic 15.4% |
| Bahamians | 0.0 /100 | #301 | Tragic 15.4% |
| Somalis | 0.0 /100 | #302 | Tragic 15.4% |
| Immigrants | Caribbean | 0.0 /100 | #303 | Tragic 15.5% |
| Immigrants | Mexico | 0.0 /100 | #304 | Tragic 15.5% |
| Immigrants | Guatemala | 0.0 /100 | #305 | Tragic 15.5% |
| Creek | 0.0 /100 | #306 | Tragic 15.6% |
| Africans | 0.0 /100 | #307 | Tragic 15.6% |
| Choctaw | 0.0 /100 | #308 | Tragic 15.6% |
| Seminole | 0.0 /100 | #309 | Tragic 15.6% |
| Dutch West Indians | 0.0 /100 | #310 | Tragic 15.6% |
| Chippewa | 0.0 /100 | #311 | Tragic 15.7% |
| Cajuns | 0.0 /100 | #312 | Tragic 15.7% |
| Immigrants | Grenada | 0.0 /100 | #313 | Tragic 15.8% |
| Immigrants | Somalia | 0.0 /100 | #314 | Tragic 15.8% |
Demographics Similar to Cheyenne by Poverty
In terms of poverty, the demographic groups most similar to Cheyenne are Pueblo (19.4%, a difference of 2.5%), Apache (18.4%, a difference of 2.8%), Houma (18.4%, a difference of 2.8%), Sioux (19.8%, a difference of 4.4%), and Native/Alaskan (18.1%, a difference of 4.9%).
| Demographics | Rating | Rank | Poverty |
| Ute | 0.0 /100 | #328 | Tragic 16.9% |
| Blacks/African Americans | 0.0 /100 | #329 | Tragic 17.3% |
| Dominicans | 0.0 /100 | #330 | Tragic 17.6% |
| Immigrants | Dominican Republic | 0.0 /100 | #331 | Tragic 17.8% |
| Natives/Alaskans | 0.0 /100 | #332 | Tragic 18.1% |
| Houma | 0.0 /100 | #333 | Tragic 18.4% |
| Apache | 0.0 /100 | #334 | Tragic 18.4% |
| Cheyenne | 0.0 /100 | #335 | Tragic 18.9% |
| Pueblo | 0.0 /100 | #336 | Tragic 19.4% |
| Sioux | 0.0 /100 | #337 | Tragic 19.8% |
| Yuman | 0.0 /100 | #338 | Tragic 20.2% |
| Crow | 0.0 /100 | #339 | Tragic 20.7% |
| Yup'ik | 0.0 /100 | #340 | Tragic 20.8% |
| Hopi | 0.0 /100 | #341 | Tragic 20.8% |
| Immigrants | Yemen | 0.0 /100 | #342 | Tragic 21.5% |