Spaniard vs Brazilian Poverty
COMPARE
Spaniard
Brazilian
Poverty
Poverty Comparison
Spaniards
Brazilians
12.8%
POVERTY
16.5/ 100
METRIC RATING
200th/ 347
METRIC RANK
11.9%
POVERTY
79.7/ 100
METRIC RATING
143rd/ 347
METRIC RANK
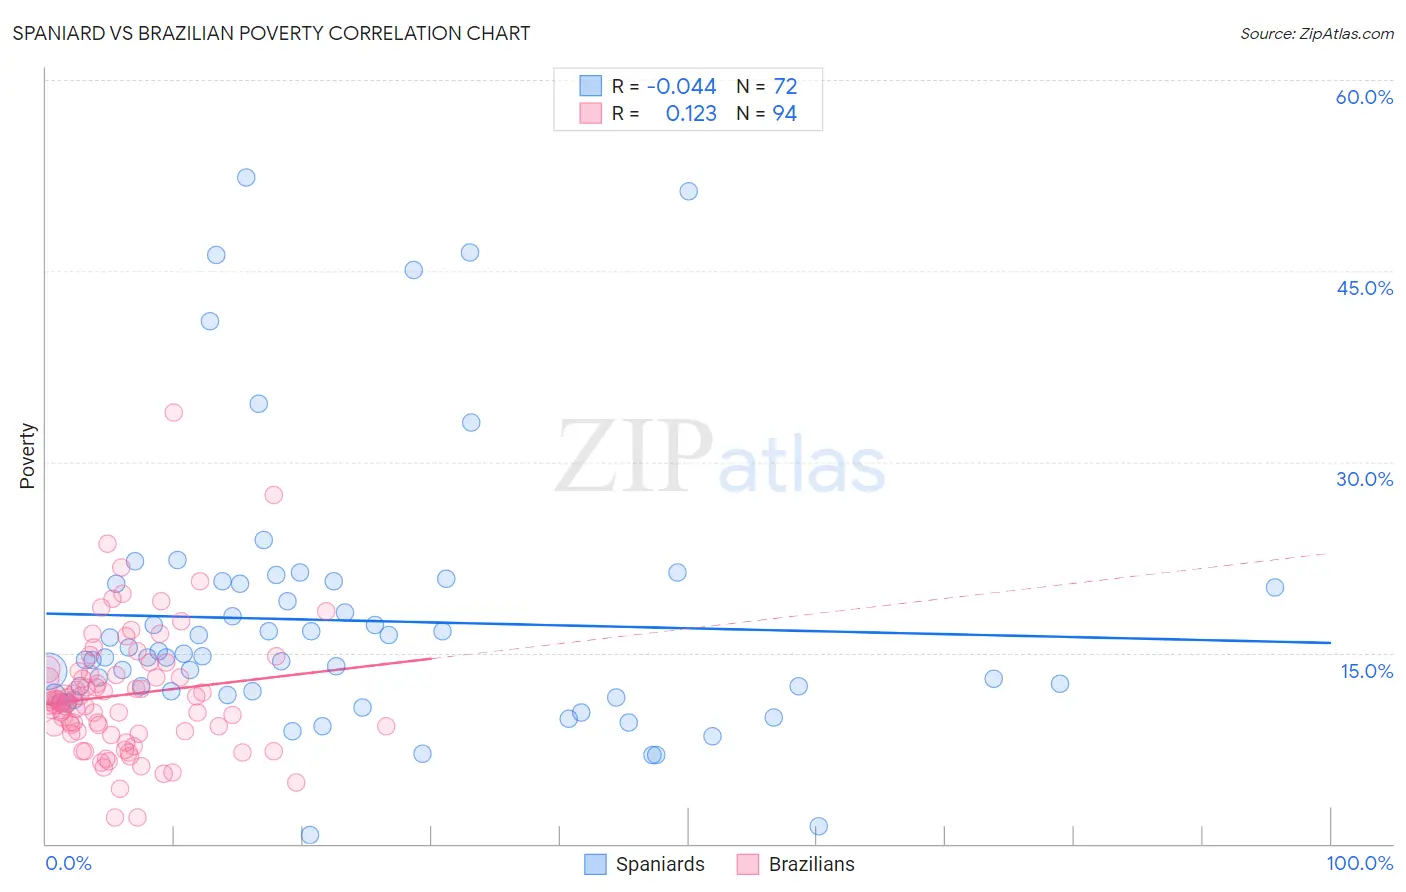
Spaniard vs Brazilian Poverty Correlation Chart
The statistical analysis conducted on geographies consisting of 443,194,534 people shows no correlation between the proportion of Spaniards and poverty level in the United States with a correlation coefficient (R) of -0.044 and weighted average of 12.8%. Similarly, the statistical analysis conducted on geographies consisting of 323,736,461 people shows a poor positive correlation between the proportion of Brazilians and poverty level in the United States with a correlation coefficient (R) of 0.123 and weighted average of 11.9%, a difference of 7.5%.
Poverty Correlation Summary
| Measurement | Spaniard | Brazilian |
| Minimum | 0.64% | 2.1% |
| Maximum | 52.4% | 33.9% |
| Range | 51.7% | 31.8% |
| Mean | 17.5% | 11.7% |
| Median | 14.7% | 11.1% |
| Interquartile 25% (IQ1) | 11.7% | 8.8% |
| Interquartile 75% (IQ3) | 20.5% | 13.3% |
| Interquartile Range (IQR) | 8.8% | 4.5% |
| Standard Deviation (Sample) | 10.6% | 5.0% |
| Standard Deviation (Population) | 10.5% | 5.0% |
Similar Demographics by Poverty
Demographics Similar to Spaniards by Poverty
In terms of poverty, the demographic groups most similar to Spaniards are Immigrants from Uganda (12.8%, a difference of 0.0%), Immigrants from Kenya (12.8%, a difference of 0.16%), Immigrants from Uruguay (12.8%, a difference of 0.16%), Hmong (12.8%, a difference of 0.27%), and Immigrants from Lebanon (12.8%, a difference of 0.35%).
| Demographics | Rating | Rank | Poverty |
| Delaware | 21.4 /100 | #193 | Fair 12.7% |
| Arabs | 21.1 /100 | #194 | Fair 12.7% |
| Immigrants | Kuwait | 20.9 /100 | #195 | Fair 12.7% |
| Iraqis | 20.8 /100 | #196 | Fair 12.7% |
| Immigrants | Lebanon | 18.7 /100 | #197 | Poor 12.8% |
| Spanish | 18.7 /100 | #198 | Poor 12.8% |
| Immigrants | Kenya | 17.5 /100 | #199 | Poor 12.8% |
| Spaniards | 16.5 /100 | #200 | Poor 12.8% |
| Immigrants | Uganda | 16.5 /100 | #201 | Poor 12.8% |
| Immigrants | Uruguay | 15.6 /100 | #202 | Poor 12.8% |
| Hmong | 15.0 /100 | #203 | Poor 12.8% |
| Immigrants | Western Asia | 14.1 /100 | #204 | Poor 12.9% |
| Tsimshian | 9.2 /100 | #205 | Tragic 13.0% |
| Immigrants | Eastern Africa | 7.0 /100 | #206 | Tragic 13.1% |
| Panamanians | 6.6 /100 | #207 | Tragic 13.1% |
Demographics Similar to Brazilians by Poverty
In terms of poverty, the demographic groups most similar to Brazilians are Basque (11.9%, a difference of 0.11%), Immigrants from France (11.9%, a difference of 0.12%), Immigrants from Peru (11.9%, a difference of 0.22%), Icelander (11.9%, a difference of 0.27%), and Pakistani (11.9%, a difference of 0.41%).
| Demographics | Rating | Rank | Poverty |
| Chileans | 84.2 /100 | #136 | Excellent 11.8% |
| Immigrants | Switzerland | 83.0 /100 | #137 | Excellent 11.8% |
| Immigrants | Jordan | 82.4 /100 | #138 | Excellent 11.9% |
| Pakistanis | 82.2 /100 | #139 | Excellent 11.9% |
| Immigrants | Peru | 81.1 /100 | #140 | Excellent 11.9% |
| Immigrants | France | 80.5 /100 | #141 | Excellent 11.9% |
| Basques | 80.4 /100 | #142 | Excellent 11.9% |
| Brazilians | 79.7 /100 | #143 | Good 11.9% |
| Icelanders | 77.9 /100 | #144 | Good 11.9% |
| Syrians | 75.1 /100 | #145 | Good 12.0% |
| Afghans | 74.9 /100 | #146 | Good 12.0% |
| Immigrants | Bosnia and Herzegovina | 73.7 /100 | #147 | Good 12.0% |
| Immigrants | Germany | 72.7 /100 | #148 | Good 12.0% |
| Immigrants | Malaysia | 72.7 /100 | #149 | Good 12.0% |
| Immigrants | Kazakhstan | 72.3 /100 | #150 | Good 12.0% |