Immigrants from Belgium vs Alsatian Family Poverty
COMPARE
Immigrants from Belgium
Alsatian
Family Poverty
Family Poverty Comparison
Immigrants from Belgium
Alsatians
7.8%
FAMILY POVERTY
98.2/ 100
METRIC RATING
69th/ 347
METRIC RANK
9.6%
FAMILY POVERTY
11.3/ 100
METRIC RATING
210th/ 347
METRIC RANK
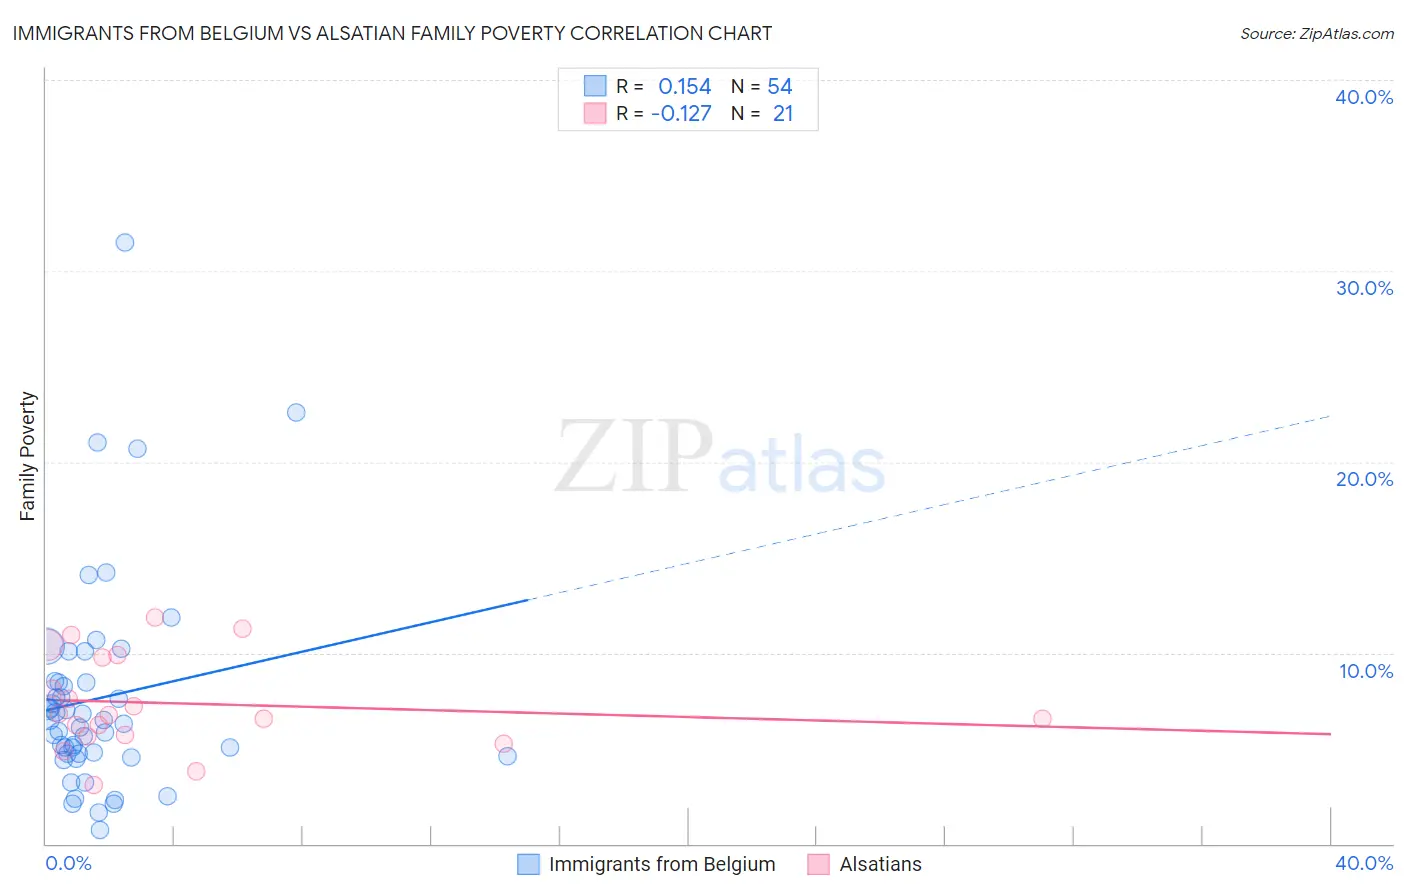
Immigrants from Belgium vs Alsatian Family Poverty Correlation Chart
The statistical analysis conducted on geographies consisting of 146,524,248 people shows a poor positive correlation between the proportion of Immigrants from Belgium and poverty level among families in the United States with a correlation coefficient (R) of 0.154 and weighted average of 7.8%. Similarly, the statistical analysis conducted on geographies consisting of 82,637,162 people shows a poor negative correlation between the proportion of Alsatians and poverty level among families in the United States with a correlation coefficient (R) of -0.127 and weighted average of 9.6%, a difference of 22.9%.
Family Poverty Correlation Summary
| Measurement | Immigrants from Belgium | Alsatian |
| Minimum | 0.69% | 3.1% |
| Maximum | 31.5% | 11.8% |
| Range | 30.8% | 8.8% |
| Mean | 7.6% | 7.4% |
| Median | 6.4% | 6.8% |
| Interquartile 25% (IQ1) | 4.7% | 5.7% |
| Interquartile 75% (IQ3) | 8.4% | 9.8% |
| Interquartile Range (IQR) | 3.7% | 4.1% |
| Standard Deviation (Sample) | 5.6% | 2.5% |
| Standard Deviation (Population) | 5.6% | 2.4% |
Similar Demographics by Family Poverty
Demographics Similar to Immigrants from Belgium by Family Poverty
In terms of family poverty, the demographic groups most similar to Immigrants from Belgium are Australian (7.8%, a difference of 0.010%), Immigrants from Canada (7.8%, a difference of 0.040%), Northern European (7.8%, a difference of 0.050%), Dutch (7.8%, a difference of 0.060%), and Cambodian (7.8%, a difference of 0.060%).
| Demographics | Rating | Rank | Family Poverty |
| Macedonians | 98.6 /100 | #62 | Exceptional 7.8% |
| Zimbabweans | 98.4 /100 | #63 | Exceptional 7.8% |
| Koreans | 98.3 /100 | #64 | Exceptional 7.8% |
| Immigrants | Bulgaria | 98.3 /100 | #65 | Exceptional 7.8% |
| Dutch | 98.3 /100 | #66 | Exceptional 7.8% |
| Northern Europeans | 98.3 /100 | #67 | Exceptional 7.8% |
| Australians | 98.2 /100 | #68 | Exceptional 7.8% |
| Immigrants | Belgium | 98.2 /100 | #69 | Exceptional 7.8% |
| Immigrants | Canada | 98.2 /100 | #70 | Exceptional 7.8% |
| Cambodians | 98.2 /100 | #71 | Exceptional 7.8% |
| Immigrants | Romania | 98.2 /100 | #72 | Exceptional 7.8% |
| Austrians | 98.2 /100 | #73 | Exceptional 7.8% |
| Immigrants | China | 98.1 /100 | #74 | Exceptional 7.8% |
| Immigrants | Croatia | 98.1 /100 | #75 | Exceptional 7.8% |
| Immigrants | Latvia | 98.0 /100 | #76 | Exceptional 7.9% |
Demographics Similar to Alsatians by Family Poverty
In terms of family poverty, the demographic groups most similar to Alsatians are Malaysian (9.6%, a difference of 0.23%), Immigrants from Thailand (9.7%, a difference of 0.54%), Immigrants from Uruguay (9.5%, a difference of 0.73%), Immigrants from Eastern Africa (9.5%, a difference of 1.0%), and Sierra Leonean (9.5%, a difference of 1.1%).
| Demographics | Rating | Rank | Family Poverty |
| German Russians | 19.4 /100 | #203 | Poor 9.4% |
| Immigrants | Lebanon | 18.9 /100 | #204 | Poor 9.4% |
| Aleuts | 18.0 /100 | #205 | Poor 9.5% |
| Immigrants | South America | 18.0 /100 | #206 | Poor 9.5% |
| Sierra Leoneans | 15.6 /100 | #207 | Poor 9.5% |
| Immigrants | Eastern Africa | 15.1 /100 | #208 | Poor 9.5% |
| Immigrants | Uruguay | 14.0 /100 | #209 | Poor 9.5% |
| Alsatians | 11.3 /100 | #210 | Poor 9.6% |
| Malaysians | 10.6 /100 | #211 | Poor 9.6% |
| Immigrants | Thailand | 9.7 /100 | #212 | Tragic 9.7% |
| Osage | 8.0 /100 | #213 | Tragic 9.7% |
| Immigrants | Micronesia | 6.7 /100 | #214 | Tragic 9.8% |
| Immigrants | Nonimmigrants | 6.7 /100 | #215 | Tragic 9.8% |
| Moroccans | 6.5 /100 | #216 | Tragic 9.8% |
| Americans | 6.2 /100 | #217 | Tragic 9.8% |