Immigrants from Belgium vs South American Family Poverty
COMPARE
Immigrants from Belgium
South American
Family Poverty
Family Poverty Comparison
Immigrants from Belgium
South Americans
7.8%
FAMILY POVERTY
98.2/ 100
METRIC RATING
69th/ 347
METRIC RANK
9.3%
FAMILY POVERTY
28.1/ 100
METRIC RATING
194th/ 347
METRIC RANK
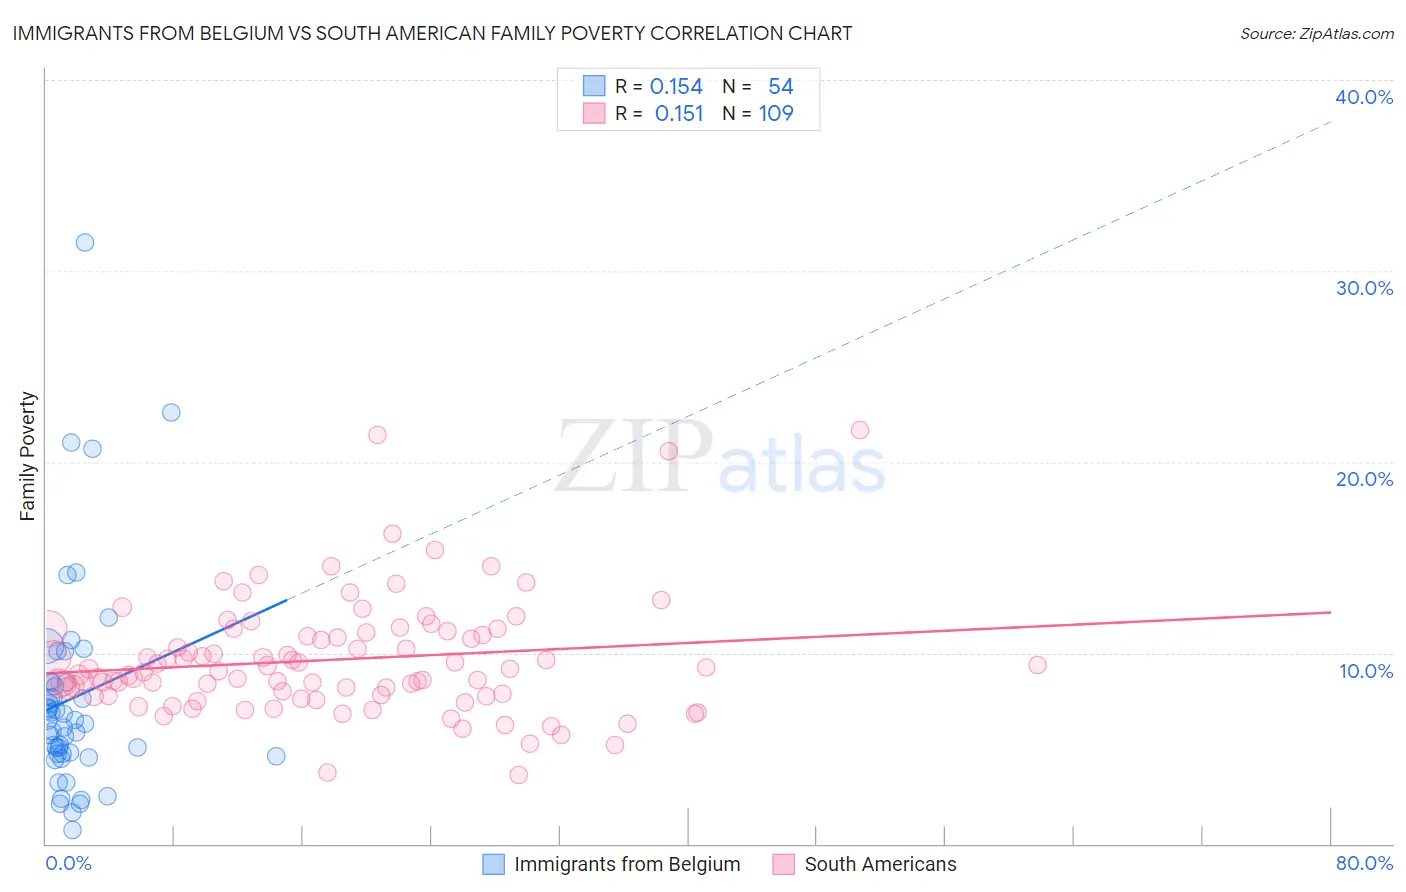
Immigrants from Belgium vs South American Family Poverty Correlation Chart
The statistical analysis conducted on geographies consisting of 146,524,248 people shows a poor positive correlation between the proportion of Immigrants from Belgium and poverty level among families in the United States with a correlation coefficient (R) of 0.154 and weighted average of 7.8%. Similarly, the statistical analysis conducted on geographies consisting of 491,953,900 people shows a poor positive correlation between the proportion of South Americans and poverty level among families in the United States with a correlation coefficient (R) of 0.151 and weighted average of 9.3%, a difference of 18.7%.
Family Poverty Correlation Summary
| Measurement | Immigrants from Belgium | South American |
| Minimum | 0.69% | 3.6% |
| Maximum | 31.5% | 21.7% |
| Range | 30.8% | 18.1% |
| Mean | 7.6% | 9.6% |
| Median | 6.4% | 9.0% |
| Interquartile 25% (IQ1) | 4.7% | 7.8% |
| Interquartile 75% (IQ3) | 8.4% | 11.0% |
| Interquartile Range (IQR) | 3.7% | 3.2% |
| Standard Deviation (Sample) | 5.6% | 3.1% |
| Standard Deviation (Population) | 5.6% | 3.1% |
Similar Demographics by Family Poverty
Demographics Similar to Immigrants from Belgium by Family Poverty
In terms of family poverty, the demographic groups most similar to Immigrants from Belgium are Australian (7.8%, a difference of 0.010%), Immigrants from Canada (7.8%, a difference of 0.040%), Northern European (7.8%, a difference of 0.050%), Dutch (7.8%, a difference of 0.060%), and Cambodian (7.8%, a difference of 0.060%).
| Demographics | Rating | Rank | Family Poverty |
| Macedonians | 98.6 /100 | #62 | Exceptional 7.8% |
| Zimbabweans | 98.4 /100 | #63 | Exceptional 7.8% |
| Koreans | 98.3 /100 | #64 | Exceptional 7.8% |
| Immigrants | Bulgaria | 98.3 /100 | #65 | Exceptional 7.8% |
| Dutch | 98.3 /100 | #66 | Exceptional 7.8% |
| Northern Europeans | 98.3 /100 | #67 | Exceptional 7.8% |
| Australians | 98.2 /100 | #68 | Exceptional 7.8% |
| Immigrants | Belgium | 98.2 /100 | #69 | Exceptional 7.8% |
| Immigrants | Canada | 98.2 /100 | #70 | Exceptional 7.8% |
| Cambodians | 98.2 /100 | #71 | Exceptional 7.8% |
| Immigrants | Romania | 98.2 /100 | #72 | Exceptional 7.8% |
| Austrians | 98.2 /100 | #73 | Exceptional 7.8% |
| Immigrants | China | 98.1 /100 | #74 | Exceptional 7.8% |
| Immigrants | Croatia | 98.1 /100 | #75 | Exceptional 7.8% |
| Immigrants | Latvia | 98.0 /100 | #76 | Exceptional 7.9% |
Demographics Similar to South Americans by Family Poverty
In terms of family poverty, the demographic groups most similar to South Americans are Immigrants from Western Asia (9.3%, a difference of 0.020%), Spanish (9.3%, a difference of 0.090%), Ugandan (9.3%, a difference of 0.10%), Venezuelan (9.3%, a difference of 0.12%), and Immigrants from Venezuela (9.3%, a difference of 0.33%).
| Demographics | Rating | Rank | Family Poverty |
| Delaware | 35.4 /100 | #187 | Fair 9.2% |
| Immigrants | Kenya | 34.0 /100 | #188 | Fair 9.2% |
| Immigrants | Afghanistan | 32.1 /100 | #189 | Fair 9.2% |
| Arabs | 31.5 /100 | #190 | Fair 9.2% |
| Ugandans | 28.7 /100 | #191 | Fair 9.3% |
| Spanish | 28.7 /100 | #192 | Fair 9.3% |
| Immigrants | Western Asia | 28.2 /100 | #193 | Fair 9.3% |
| South Americans | 28.1 /100 | #194 | Fair 9.3% |
| Venezuelans | 27.4 /100 | #195 | Fair 9.3% |
| Immigrants | Venezuela | 26.1 /100 | #196 | Fair 9.3% |
| Immigrants | Colombia | 24.4 /100 | #197 | Fair 9.3% |
| Iraqis | 24.2 /100 | #198 | Fair 9.3% |
| Spaniards | 22.8 /100 | #199 | Fair 9.4% |
| Immigrants | Costa Rica | 21.7 /100 | #200 | Fair 9.4% |
| Immigrants | Portugal | 20.5 /100 | #201 | Fair 9.4% |