Immigrants from Belgium vs Immigrants from Brazil Family Poverty
COMPARE
Immigrants from Belgium
Immigrants from Brazil
Family Poverty
Family Poverty Comparison
Immigrants from Belgium
Immigrants from Brazil
7.8%
FAMILY POVERTY
98.2/ 100
METRIC RATING
69th/ 347
METRIC RANK
8.5%
FAMILY POVERTY
86.3/ 100
METRIC RATING
136th/ 347
METRIC RANK
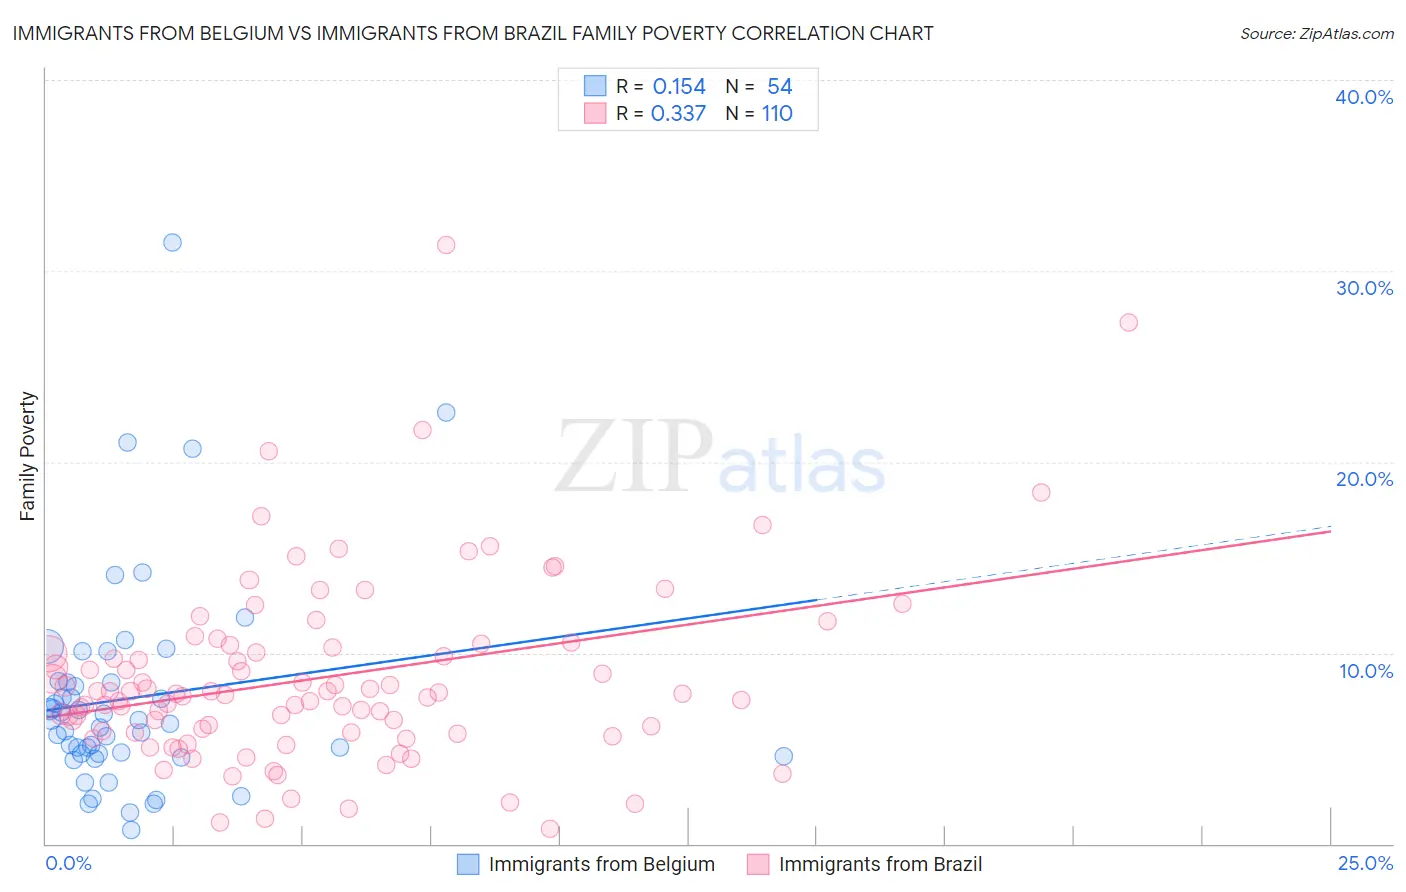
Immigrants from Belgium vs Immigrants from Brazil Family Poverty Correlation Chart
The statistical analysis conducted on geographies consisting of 146,524,248 people shows a poor positive correlation between the proportion of Immigrants from Belgium and poverty level among families in the United States with a correlation coefficient (R) of 0.154 and weighted average of 7.8%. Similarly, the statistical analysis conducted on geographies consisting of 342,227,050 people shows a mild positive correlation between the proportion of Immigrants from Brazil and poverty level among families in the United States with a correlation coefficient (R) of 0.337 and weighted average of 8.5%, a difference of 8.2%.
Family Poverty Correlation Summary
| Measurement | Immigrants from Belgium | Immigrants from Brazil |
| Minimum | 0.69% | 0.81% |
| Maximum | 31.5% | 31.4% |
| Range | 30.8% | 30.6% |
| Mean | 7.6% | 8.7% |
| Median | 6.4% | 7.8% |
| Interquartile 25% (IQ1) | 4.7% | 5.9% |
| Interquartile 75% (IQ3) | 8.4% | 10.3% |
| Interquartile Range (IQR) | 3.7% | 4.4% |
| Standard Deviation (Sample) | 5.6% | 4.9% |
| Standard Deviation (Population) | 5.6% | 4.9% |
Similar Demographics by Family Poverty
Demographics Similar to Immigrants from Belgium by Family Poverty
In terms of family poverty, the demographic groups most similar to Immigrants from Belgium are Australian (7.8%, a difference of 0.010%), Immigrants from Canada (7.8%, a difference of 0.040%), Northern European (7.8%, a difference of 0.050%), Dutch (7.8%, a difference of 0.060%), and Cambodian (7.8%, a difference of 0.060%).
| Demographics | Rating | Rank | Family Poverty |
| Macedonians | 98.6 /100 | #62 | Exceptional 7.8% |
| Zimbabweans | 98.4 /100 | #63 | Exceptional 7.8% |
| Koreans | 98.3 /100 | #64 | Exceptional 7.8% |
| Immigrants | Bulgaria | 98.3 /100 | #65 | Exceptional 7.8% |
| Dutch | 98.3 /100 | #66 | Exceptional 7.8% |
| Northern Europeans | 98.3 /100 | #67 | Exceptional 7.8% |
| Australians | 98.2 /100 | #68 | Exceptional 7.8% |
| Immigrants | Belgium | 98.2 /100 | #69 | Exceptional 7.8% |
| Immigrants | Canada | 98.2 /100 | #70 | Exceptional 7.8% |
| Cambodians | 98.2 /100 | #71 | Exceptional 7.8% |
| Immigrants | Romania | 98.2 /100 | #72 | Exceptional 7.8% |
| Austrians | 98.2 /100 | #73 | Exceptional 7.8% |
| Immigrants | China | 98.1 /100 | #74 | Exceptional 7.8% |
| Immigrants | Croatia | 98.1 /100 | #75 | Exceptional 7.8% |
| Immigrants | Latvia | 98.0 /100 | #76 | Exceptional 7.9% |
Demographics Similar to Immigrants from Brazil by Family Poverty
In terms of family poverty, the demographic groups most similar to Immigrants from Brazil are Immigrants from Malaysia (8.5%, a difference of 0.040%), Chilean (8.5%, a difference of 0.080%), Immigrants from Southern Europe (8.5%, a difference of 0.080%), Sri Lankan (8.5%, a difference of 0.090%), and Armenian (8.5%, a difference of 0.48%).
| Demographics | Rating | Rank | Family Poverty |
| Portuguese | 89.2 /100 | #129 | Excellent 8.4% |
| Immigrants | Bosnia and Herzegovina | 88.6 /100 | #130 | Excellent 8.4% |
| Puget Sound Salish | 88.6 /100 | #131 | Excellent 8.4% |
| Immigrants | Argentina | 88.2 /100 | #132 | Excellent 8.4% |
| Sri Lankans | 86.6 /100 | #133 | Excellent 8.5% |
| Chileans | 86.6 /100 | #134 | Excellent 8.5% |
| Immigrants | Malaysia | 86.5 /100 | #135 | Excellent 8.5% |
| Immigrants | Brazil | 86.3 /100 | #136 | Excellent 8.5% |
| Immigrants | Southern Europe | 86.0 /100 | #137 | Excellent 8.5% |
| Armenians | 84.6 /100 | #138 | Excellent 8.5% |
| Immigrants | Nepal | 84.2 /100 | #139 | Excellent 8.5% |
| Immigrants | Kazakhstan | 84.1 /100 | #140 | Excellent 8.5% |
| Immigrants | Ukraine | 83.9 /100 | #141 | Excellent 8.5% |
| Yugoslavians | 83.5 /100 | #142 | Excellent 8.5% |
| Immigrants | Germany | 83.3 /100 | #143 | Excellent 8.5% |