Immigrants from Bahamas vs Filipino Female Poverty
COMPARE
Immigrants from Bahamas
Filipino
Female Poverty
Female Poverty Comparison
Immigrants from Bahamas
Filipinos
16.1%
FEMALE POVERTY
0.0/ 100
METRIC RATING
279th/ 347
METRIC RANK
10.9%
FEMALE POVERTY
100.0/ 100
METRIC RATING
5th/ 347
METRIC RANK
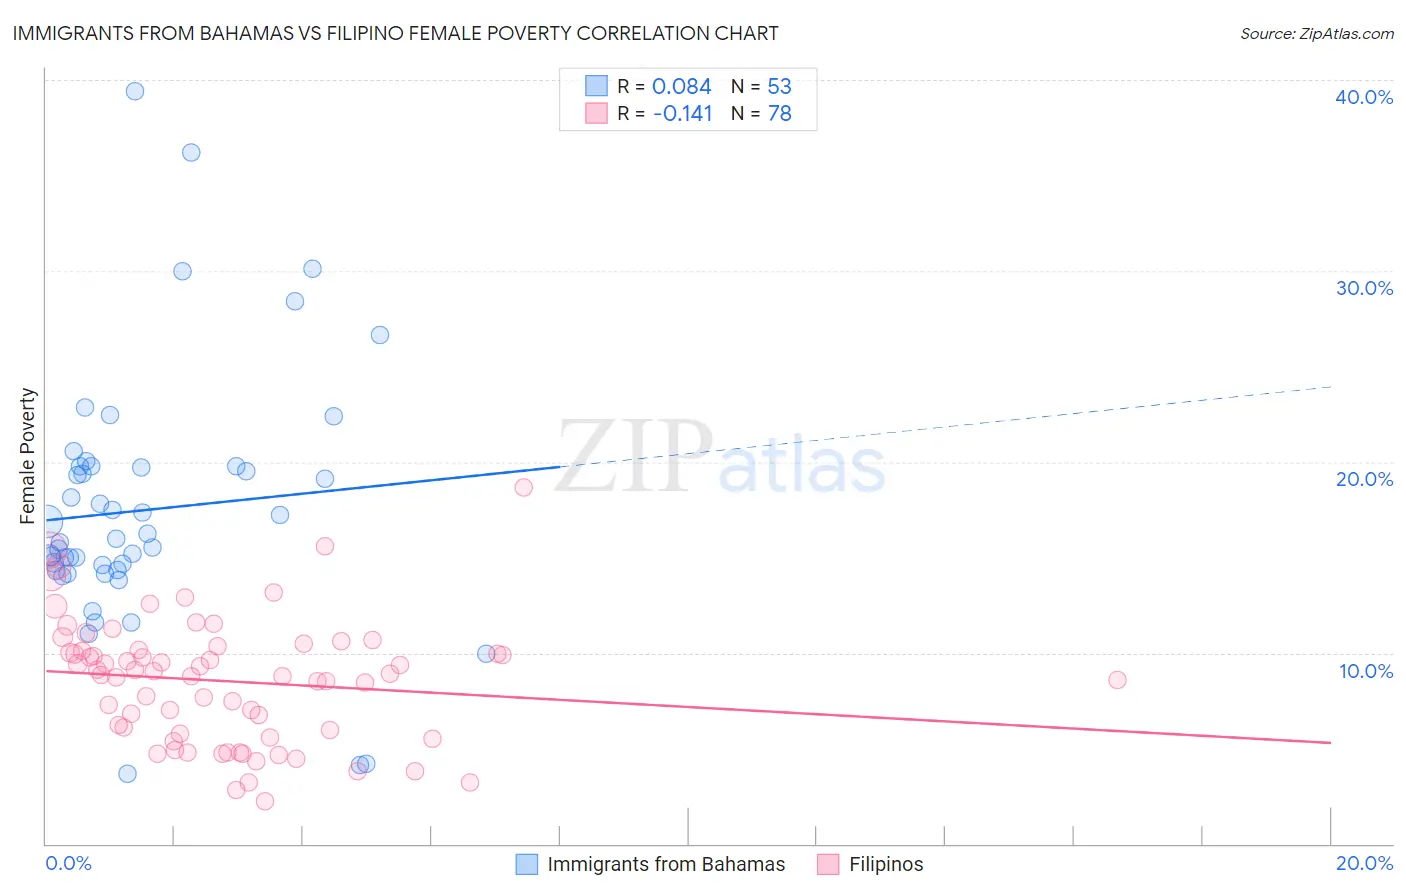
Immigrants from Bahamas vs Filipino Female Poverty Correlation Chart
The statistical analysis conducted on geographies consisting of 104,605,923 people shows a slight positive correlation between the proportion of Immigrants from Bahamas and poverty level among females in the United States with a correlation coefficient (R) of 0.084 and weighted average of 16.1%. Similarly, the statistical analysis conducted on geographies consisting of 254,106,597 people shows a poor negative correlation between the proportion of Filipinos and poverty level among females in the United States with a correlation coefficient (R) of -0.141 and weighted average of 10.9%, a difference of 46.8%.
Female Poverty Correlation Summary
| Measurement | Immigrants from Bahamas | Filipino |
| Minimum | 3.7% | 2.2% |
| Maximum | 39.4% | 18.6% |
| Range | 35.8% | 16.4% |
| Mean | 17.5% | 8.5% |
| Median | 16.0% | 8.9% |
| Interquartile 25% (IQ1) | 14.3% | 5.7% |
| Interquartile 75% (IQ3) | 19.8% | 10.2% |
| Interquartile Range (IQR) | 5.4% | 4.4% |
| Standard Deviation (Sample) | 6.7% | 3.3% |
| Standard Deviation (Population) | 6.7% | 3.2% |
Similar Demographics by Female Poverty
Demographics Similar to Immigrants from Bahamas by Female Poverty
In terms of female poverty, the demographic groups most similar to Immigrants from Bahamas are Immigrants from West Indies (16.1%, a difference of 0.12%), Vietnamese (16.1%, a difference of 0.24%), West Indian (16.1%, a difference of 0.26%), Immigrants from Haiti (16.1%, a difference of 0.41%), and Bangladeshi (16.0%, a difference of 0.42%).
| Demographics | Rating | Rank | Female Poverty |
| Belizeans | 0.0 /100 | #272 | Tragic 15.9% |
| Haitians | 0.0 /100 | #273 | Tragic 15.9% |
| Barbadians | 0.0 /100 | #274 | Tragic 15.9% |
| Immigrants | Barbados | 0.0 /100 | #275 | Tragic 16.0% |
| Central Americans | 0.0 /100 | #276 | Tragic 16.0% |
| Bangladeshis | 0.0 /100 | #277 | Tragic 16.0% |
| Immigrants | West Indies | 0.0 /100 | #278 | Tragic 16.1% |
| Immigrants | Bahamas | 0.0 /100 | #279 | Tragic 16.1% |
| Vietnamese | 0.0 /100 | #280 | Tragic 16.1% |
| West Indians | 0.0 /100 | #281 | Tragic 16.1% |
| Immigrants | Haiti | 0.0 /100 | #282 | Tragic 16.1% |
| Immigrants | Cuba | 0.0 /100 | #283 | Tragic 16.1% |
| Spanish Americans | 0.0 /100 | #284 | Tragic 16.2% |
| Comanche | 0.0 /100 | #285 | Tragic 16.2% |
| Inupiat | 0.0 /100 | #286 | Tragic 16.2% |
Demographics Similar to Filipinos by Female Poverty
In terms of female poverty, the demographic groups most similar to Filipinos are Immigrants from Ireland (11.0%, a difference of 0.38%), Assyrian/Chaldean/Syriac (11.0%, a difference of 0.75%), Immigrants from South Central Asia (11.1%, a difference of 1.5%), Bulgarian (11.1%, a difference of 1.7%), and Immigrants from Hong Kong (11.2%, a difference of 2.5%).
| Demographics | Rating | Rank | Female Poverty |
| Immigrants | India | 100.0 /100 | #1 | Exceptional 9.9% |
| Chinese | 100.0 /100 | #2 | Exceptional 10.4% |
| Thais | 100.0 /100 | #3 | Exceptional 10.5% |
| Immigrants | Taiwan | 100.0 /100 | #4 | Exceptional 10.5% |
| Filipinos | 100.0 /100 | #5 | Exceptional 10.9% |
| Immigrants | Ireland | 99.9 /100 | #6 | Exceptional 11.0% |
| Assyrians/Chaldeans/Syriacs | 99.9 /100 | #7 | Exceptional 11.0% |
| Immigrants | South Central Asia | 99.9 /100 | #8 | Exceptional 11.1% |
| Bulgarians | 99.9 /100 | #9 | Exceptional 11.1% |
| Immigrants | Hong Kong | 99.9 /100 | #10 | Exceptional 11.2% |
| Maltese | 99.9 /100 | #11 | Exceptional 11.2% |
| Bhutanese | 99.9 /100 | #12 | Exceptional 11.3% |
| Immigrants | Lithuania | 99.9 /100 | #13 | Exceptional 11.3% |
| Lithuanians | 99.8 /100 | #14 | Exceptional 11.4% |
| Latvians | 99.8 /100 | #15 | Exceptional 11.4% |