Immigrants from Bahamas vs Greek Seniors Poverty Over the Age of 75
COMPARE
Immigrants from Bahamas
Greek
Seniors Poverty Over the Age of 75
Seniors Poverty Over the Age of 75 Comparison
Immigrants from Bahamas
Greeks
14.4%
SENIORS POVERTY OVER THE AGE OF 75
0.0/ 100
METRIC RATING
274th/ 347
METRIC RANK
11.1%
SENIORS POVERTY OVER THE AGE OF 75
99.0/ 100
METRIC RATING
46th/ 347
METRIC RANK
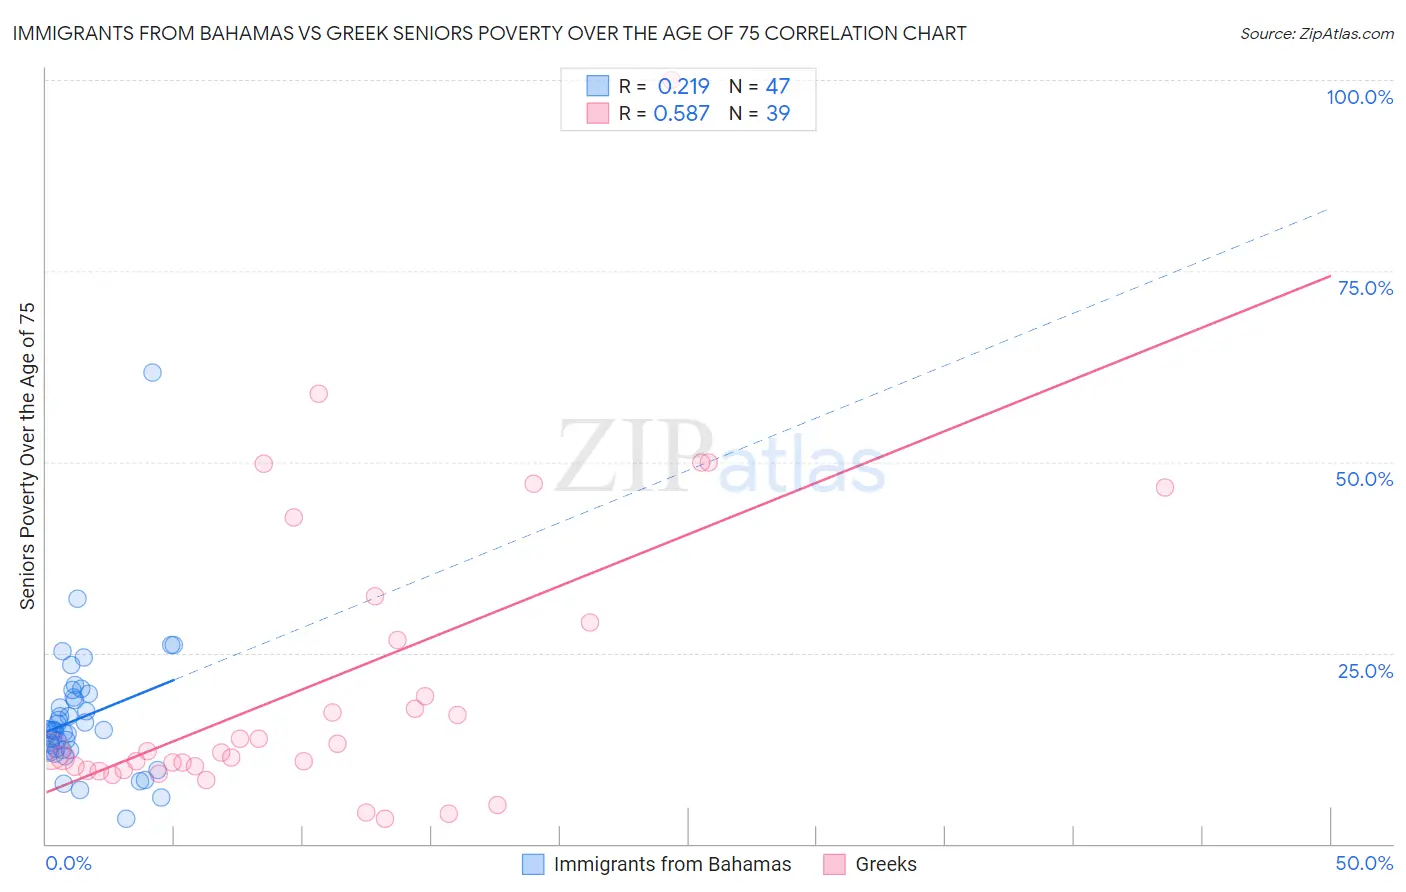
Immigrants from Bahamas vs Greek Seniors Poverty Over the Age of 75 Correlation Chart
The statistical analysis conducted on geographies consisting of 104,312,538 people shows a weak positive correlation between the proportion of Immigrants from Bahamas and poverty level among seniors over the age of 75 in the United States with a correlation coefficient (R) of 0.219 and weighted average of 14.4%. Similarly, the statistical analysis conducted on geographies consisting of 474,334,597 people shows a substantial positive correlation between the proportion of Greeks and poverty level among seniors over the age of 75 in the United States with a correlation coefficient (R) of 0.587 and weighted average of 11.1%, a difference of 30.5%.
Seniors Poverty Over the Age of 75 Correlation Summary
| Measurement | Immigrants from Bahamas | Greek |
| Minimum | 3.3% | 3.3% |
| Maximum | 61.7% | 100.0% |
| Range | 58.4% | 96.7% |
| Mean | 16.5% | 21.5% |
| Median | 14.8% | 12.1% |
| Interquartile 25% (IQ1) | 12.2% | 9.7% |
| Interquartile 75% (IQ3) | 19.2% | 29.0% |
| Interquartile Range (IQR) | 7.0% | 19.3% |
| Standard Deviation (Sample) | 8.8% | 20.2% |
| Standard Deviation (Population) | 8.7% | 19.9% |
Similar Demographics by Seniors Poverty Over the Age of 75
Demographics Similar to Immigrants from Bahamas by Seniors Poverty Over the Age of 75
In terms of seniors poverty over the age of 75, the demographic groups most similar to Immigrants from Bahamas are Immigrants from El Salvador (14.5%, a difference of 0.16%), Immigrants from South America (14.4%, a difference of 0.17%), Soviet Union (14.5%, a difference of 0.21%), Mexican (14.4%, a difference of 0.39%), and Senegalese (14.5%, a difference of 0.49%).
| Demographics | Rating | Rank | Seniors Poverty Over the Age of 75 |
| Venezuelans | 0.0 /100 | #267 | Tragic 14.2% |
| Colombians | 0.0 /100 | #268 | Tragic 14.3% |
| Immigrants | Venezuela | 0.0 /100 | #269 | Tragic 14.3% |
| Immigrants | Uruguay | 0.0 /100 | #270 | Tragic 14.3% |
| Immigrants | Ghana | 0.0 /100 | #271 | Tragic 14.4% |
| Mexicans | 0.0 /100 | #272 | Tragic 14.4% |
| Immigrants | South America | 0.0 /100 | #273 | Tragic 14.4% |
| Immigrants | Bahamas | 0.0 /100 | #274 | Tragic 14.4% |
| Immigrants | El Salvador | 0.0 /100 | #275 | Tragic 14.5% |
| Soviet Union | 0.0 /100 | #276 | Tragic 14.5% |
| Senegalese | 0.0 /100 | #277 | Tragic 14.5% |
| Immigrants | Colombia | 0.0 /100 | #278 | Tragic 14.6% |
| Blacks/African Americans | 0.0 /100 | #279 | Tragic 14.6% |
| Central Americans | 0.0 /100 | #280 | Tragic 14.7% |
| Belizeans | 0.0 /100 | #281 | Tragic 14.8% |
Demographics Similar to Greeks by Seniors Poverty Over the Age of 75
In terms of seniors poverty over the age of 75, the demographic groups most similar to Greeks are Carpatho Rusyn (11.1%, a difference of 0.060%), Belgian (11.0%, a difference of 0.33%), Celtic (11.0%, a difference of 0.36%), Austrian (11.0%, a difference of 0.42%), and Hawaiian (11.1%, a difference of 0.44%).
| Demographics | Rating | Rank | Seniors Poverty Over the Age of 75 |
| Czechoslovakians | 99.4 /100 | #39 | Exceptional 10.9% |
| Thais | 99.4 /100 | #40 | Exceptional 10.9% |
| Immigrants | Lithuania | 99.2 /100 | #41 | Exceptional 11.0% |
| Austrians | 99.1 /100 | #42 | Exceptional 11.0% |
| Celtics | 99.1 /100 | #43 | Exceptional 11.0% |
| Belgians | 99.1 /100 | #44 | Exceptional 11.0% |
| Carpatho Rusyns | 99.0 /100 | #45 | Exceptional 11.1% |
| Greeks | 99.0 /100 | #46 | Exceptional 11.1% |
| Hawaiians | 98.8 /100 | #47 | Exceptional 11.1% |
| French | 98.7 /100 | #48 | Exceptional 11.1% |
| Samoans | 98.7 /100 | #49 | Exceptional 11.1% |
| Serbians | 98.6 /100 | #50 | Exceptional 11.1% |
| Immigrants | North Macedonia | 98.6 /100 | #51 | Exceptional 11.1% |
| Zimbabweans | 98.5 /100 | #52 | Exceptional 11.2% |
| Immigrants | England | 98.4 /100 | #53 | Exceptional 11.2% |