African vs Greek Poverty
COMPARE
African
Greek
Poverty
Poverty Comparison
Africans
Greeks
15.6%
POVERTY
0.0/ 100
METRIC RATING
307th/ 347
METRIC RANK
10.7%
POVERTY
99.5/ 100
METRIC RATING
29th/ 347
METRIC RANK
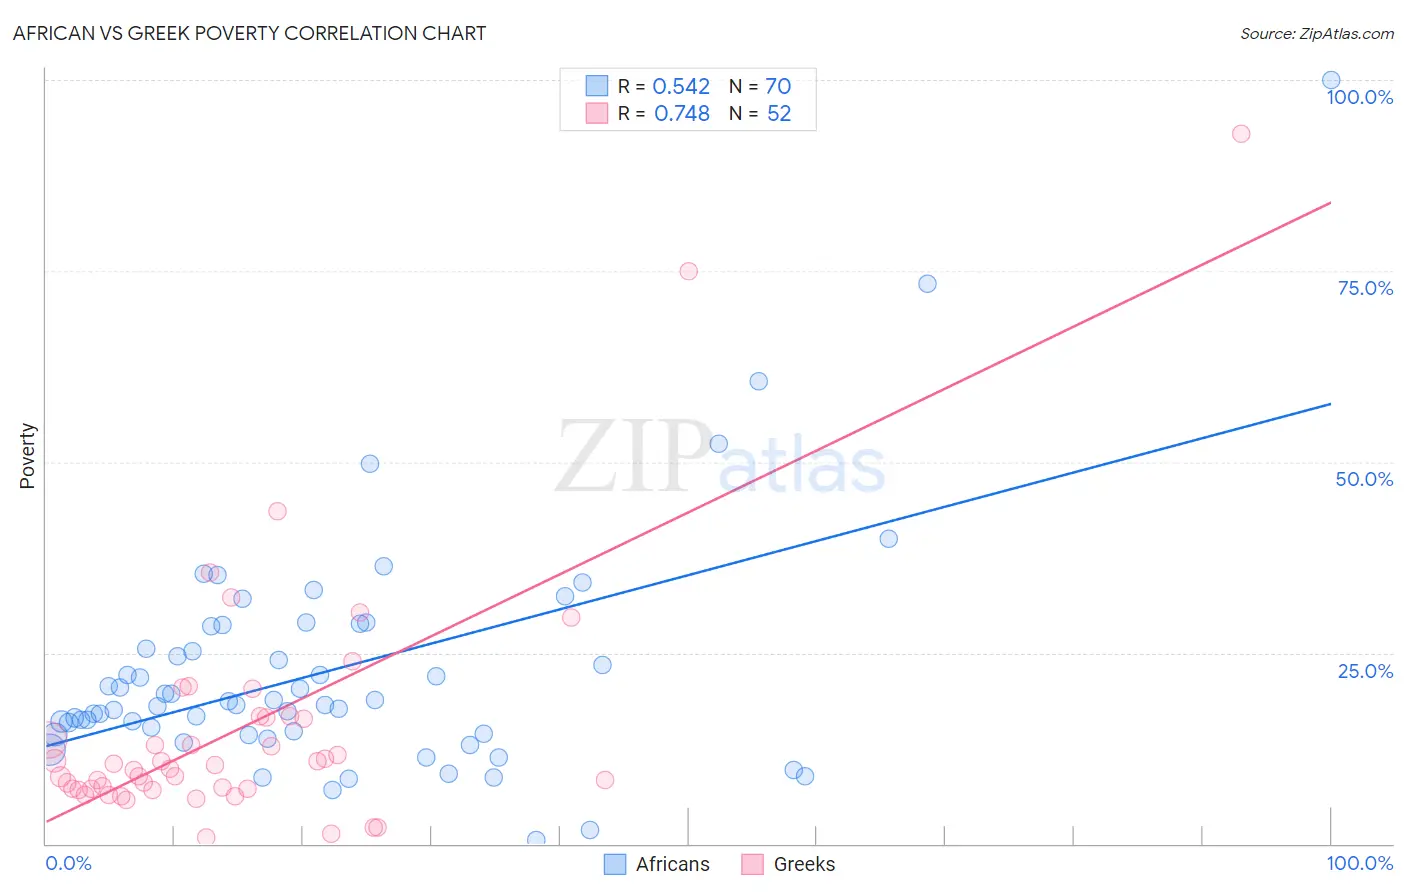
African vs Greek Poverty Correlation Chart
The statistical analysis conducted on geographies consisting of 469,617,855 people shows a substantial positive correlation between the proportion of Africans and poverty level in the United States with a correlation coefficient (R) of 0.542 and weighted average of 15.6%. Similarly, the statistical analysis conducted on geographies consisting of 482,333,537 people shows a strong positive correlation between the proportion of Greeks and poverty level in the United States with a correlation coefficient (R) of 0.748 and weighted average of 10.7%, a difference of 45.3%.
Poverty Correlation Summary
| Measurement | African | Greek |
| Minimum | 0.57% | 0.75% |
| Maximum | 100.0% | 93.0% |
| Range | 99.4% | 92.3% |
| Mean | 22.7% | 15.2% |
| Median | 18.4% | 10.1% |
| Interquartile 25% (IQ1) | 14.4% | 7.2% |
| Interquartile 75% (IQ3) | 28.5% | 16.6% |
| Interquartile Range (IQR) | 14.0% | 9.4% |
| Standard Deviation (Sample) | 15.6% | 16.5% |
| Standard Deviation (Population) | 15.5% | 16.4% |
Similar Demographics by Poverty
Demographics Similar to Africans by Poverty
In terms of poverty, the demographic groups most similar to Africans are Creek (15.6%, a difference of 0.070%), Choctaw (15.6%, a difference of 0.11%), Seminole (15.6%, a difference of 0.15%), Dutch West Indian (15.6%, a difference of 0.24%), and Immigrants from Guatemala (15.5%, a difference of 0.51%).
| Demographics | Rating | Rank | Poverty |
| Immigrants | Central America | 0.0 /100 | #300 | Tragic 15.4% |
| Bahamians | 0.0 /100 | #301 | Tragic 15.4% |
| Somalis | 0.0 /100 | #302 | Tragic 15.4% |
| Immigrants | Caribbean | 0.0 /100 | #303 | Tragic 15.5% |
| Immigrants | Mexico | 0.0 /100 | #304 | Tragic 15.5% |
| Immigrants | Guatemala | 0.0 /100 | #305 | Tragic 15.5% |
| Creek | 0.0 /100 | #306 | Tragic 15.6% |
| Africans | 0.0 /100 | #307 | Tragic 15.6% |
| Choctaw | 0.0 /100 | #308 | Tragic 15.6% |
| Seminole | 0.0 /100 | #309 | Tragic 15.6% |
| Dutch West Indians | 0.0 /100 | #310 | Tragic 15.6% |
| Chippewa | 0.0 /100 | #311 | Tragic 15.7% |
| Cajuns | 0.0 /100 | #312 | Tragic 15.7% |
| Immigrants | Grenada | 0.0 /100 | #313 | Tragic 15.8% |
| Immigrants | Somalia | 0.0 /100 | #314 | Tragic 15.8% |
Demographics Similar to Greeks by Poverty
In terms of poverty, the demographic groups most similar to Greeks are Danish (10.7%, a difference of 0.010%), Immigrants from Korea (10.7%, a difference of 0.090%), Polish (10.7%, a difference of 0.090%), Immigrants from Northern Europe (10.7%, a difference of 0.16%), and Iranian (10.7%, a difference of 0.18%).
| Demographics | Rating | Rank | Poverty |
| Eastern Europeans | 99.7 /100 | #22 | Exceptional 10.6% |
| Swedes | 99.7 /100 | #23 | Exceptional 10.6% |
| Italians | 99.7 /100 | #24 | Exceptional 10.6% |
| Croatians | 99.6 /100 | #25 | Exceptional 10.6% |
| Burmese | 99.6 /100 | #26 | Exceptional 10.7% |
| Immigrants | Northern Europe | 99.6 /100 | #27 | Exceptional 10.7% |
| Immigrants | Korea | 99.5 /100 | #28 | Exceptional 10.7% |
| Greeks | 99.5 /100 | #29 | Exceptional 10.7% |
| Danes | 99.5 /100 | #30 | Exceptional 10.7% |
| Poles | 99.5 /100 | #31 | Exceptional 10.7% |
| Iranians | 99.5 /100 | #32 | Exceptional 10.7% |
| Macedonians | 99.4 /100 | #33 | Exceptional 10.8% |
| Immigrants | Poland | 99.4 /100 | #34 | Exceptional 10.8% |
| Tongans | 99.4 /100 | #35 | Exceptional 10.8% |
| Cypriots | 99.3 /100 | #36 | Exceptional 10.8% |