Immigrants from the Azores vs Costa Rican Disability Age 18 to 34
COMPARE
Immigrants from the Azores
Costa Rican
Disability Age 18 to 34
Disability Age 18 to 34 Comparison
Immigrants from the Azores
Costa Ricans
8.5%
DISABILITY AGE 18 TO 34
0.0/ 100
METRIC RATING
336th/ 347
METRIC RANK
6.3%
DISABILITY AGE 18 TO 34
92.9/ 100
METRIC RATING
123rd/ 347
METRIC RANK
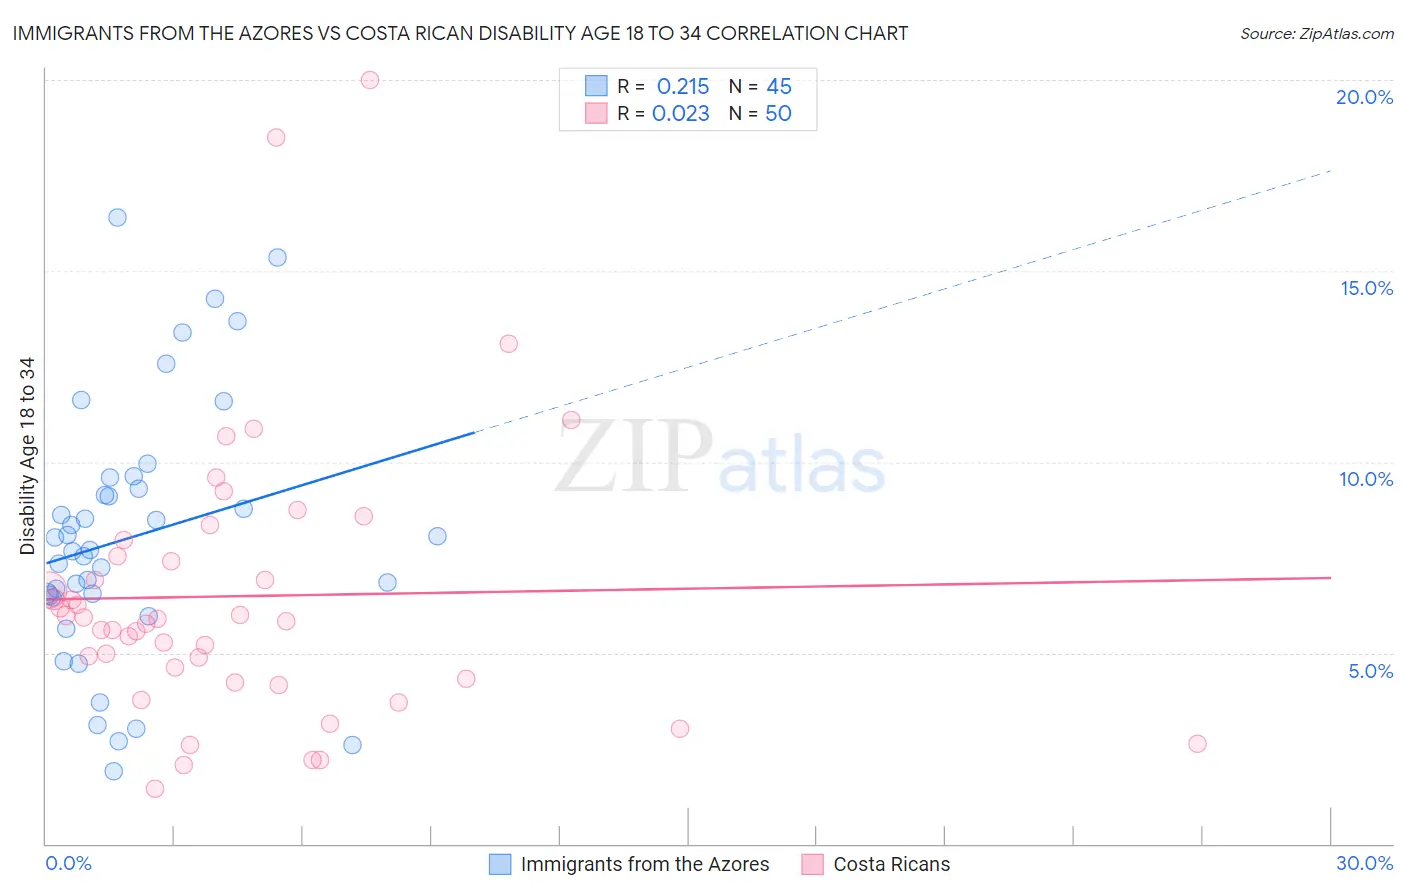
Immigrants from the Azores vs Costa Rican Disability Age 18 to 34 Correlation Chart
The statistical analysis conducted on geographies consisting of 46,222,932 people shows a weak positive correlation between the proportion of Immigrants from the Azores and percentage of population with a disability between the ages 18 and 35 in the United States with a correlation coefficient (R) of 0.215 and weighted average of 8.5%. Similarly, the statistical analysis conducted on geographies consisting of 253,342,292 people shows no correlation between the proportion of Costa Ricans and percentage of population with a disability between the ages 18 and 35 in the United States with a correlation coefficient (R) of 0.023 and weighted average of 6.3%, a difference of 35.5%.
Disability Age 18 to 34 Correlation Summary
| Measurement | Immigrants from the Azores | Costa Rican |
| Minimum | 1.9% | 1.4% |
| Maximum | 16.4% | 20.0% |
| Range | 14.5% | 18.6% |
| Mean | 8.0% | 6.5% |
| Median | 7.7% | 5.9% |
| Interquartile 25% (IQ1) | 6.5% | 4.3% |
| Interquartile 75% (IQ3) | 9.4% | 7.5% |
| Interquartile Range (IQR) | 3.0% | 3.2% |
| Standard Deviation (Sample) | 3.4% | 3.6% |
| Standard Deviation (Population) | 3.3% | 3.6% |
Similar Demographics by Disability Age 18 to 34
Demographics Similar to Immigrants from the Azores by Disability Age 18 to 34
In terms of disability age 18 to 34, the demographic groups most similar to Immigrants from the Azores are Ottawa (8.6%, a difference of 0.47%), Seminole (8.4%, a difference of 1.2%), Dutch West Indian (8.4%, a difference of 1.3%), Apache (8.4%, a difference of 1.5%), and Cherokee (8.7%, a difference of 1.9%).
| Demographics | Rating | Rank | Disability Age 18 to 34 |
| Crow | 0.0 /100 | #329 | Tragic 8.3% |
| Osage | 0.0 /100 | #330 | Tragic 8.3% |
| Comanche | 0.0 /100 | #331 | Tragic 8.3% |
| Puget Sound Salish | 0.0 /100 | #332 | Tragic 8.3% |
| Apache | 0.0 /100 | #333 | Tragic 8.4% |
| Dutch West Indians | 0.0 /100 | #334 | Tragic 8.4% |
| Seminole | 0.0 /100 | #335 | Tragic 8.4% |
| Immigrants | Azores | 0.0 /100 | #336 | Tragic 8.5% |
| Ottawa | 0.0 /100 | #337 | Tragic 8.6% |
| Cherokee | 0.0 /100 | #338 | Tragic 8.7% |
| Kiowa | 0.0 /100 | #339 | Tragic 8.8% |
| Choctaw | 0.0 /100 | #340 | Tragic 9.0% |
| Chickasaw | 0.0 /100 | #341 | Tragic 9.0% |
| Yakama | 0.0 /100 | #342 | Tragic 9.0% |
| Chippewa | 0.0 /100 | #343 | Tragic 9.0% |
Demographics Similar to Costa Ricans by Disability Age 18 to 34
In terms of disability age 18 to 34, the demographic groups most similar to Costa Ricans are Immigrants from Morocco (6.3%, a difference of 0.020%), Macedonian (6.3%, a difference of 0.080%), Immigrants from Czechoslovakia (6.3%, a difference of 0.11%), Immigrants from Switzerland (6.3%, a difference of 0.11%), and Immigrants from Guatemala (6.3%, a difference of 0.12%).
| Demographics | Rating | Rank | Disability Age 18 to 34 |
| Immigrants | Costa Rica | 94.0 /100 | #116 | Exceptional 6.3% |
| Immigrants | Jordan | 94.0 /100 | #117 | Exceptional 6.3% |
| Immigrants | Nepal | 93.7 /100 | #118 | Exceptional 6.3% |
| Chileans | 93.5 /100 | #119 | Exceptional 6.3% |
| Immigrants | Ukraine | 93.4 /100 | #120 | Exceptional 6.3% |
| Immigrants | Guatemala | 93.4 /100 | #121 | Exceptional 6.3% |
| Immigrants | Czechoslovakia | 93.3 /100 | #122 | Exceptional 6.3% |
| Costa Ricans | 92.9 /100 | #123 | Exceptional 6.3% |
| Immigrants | Morocco | 92.9 /100 | #124 | Exceptional 6.3% |
| Macedonians | 92.6 /100 | #125 | Exceptional 6.3% |
| Immigrants | Switzerland | 92.5 /100 | #126 | Exceptional 6.3% |
| West Indians | 92.0 /100 | #127 | Exceptional 6.3% |
| Chinese | 91.9 /100 | #128 | Exceptional 6.3% |
| Immigrants | Italy | 90.5 /100 | #129 | Exceptional 6.3% |
| Immigrants | Dominica | 90.5 /100 | #130 | Exceptional 6.3% |