Immigrants from Albania vs Sierra Leonean Female Poverty
COMPARE
Immigrants from Albania
Sierra Leonean
Female Poverty
Female Poverty Comparison
Immigrants from Albania
Sierra Leoneans
13.3%
FEMALE POVERTY
62.4/ 100
METRIC RATING
163rd/ 347
METRIC RANK
13.7%
FEMALE POVERTY
33.1/ 100
METRIC RATING
190th/ 347
METRIC RANK
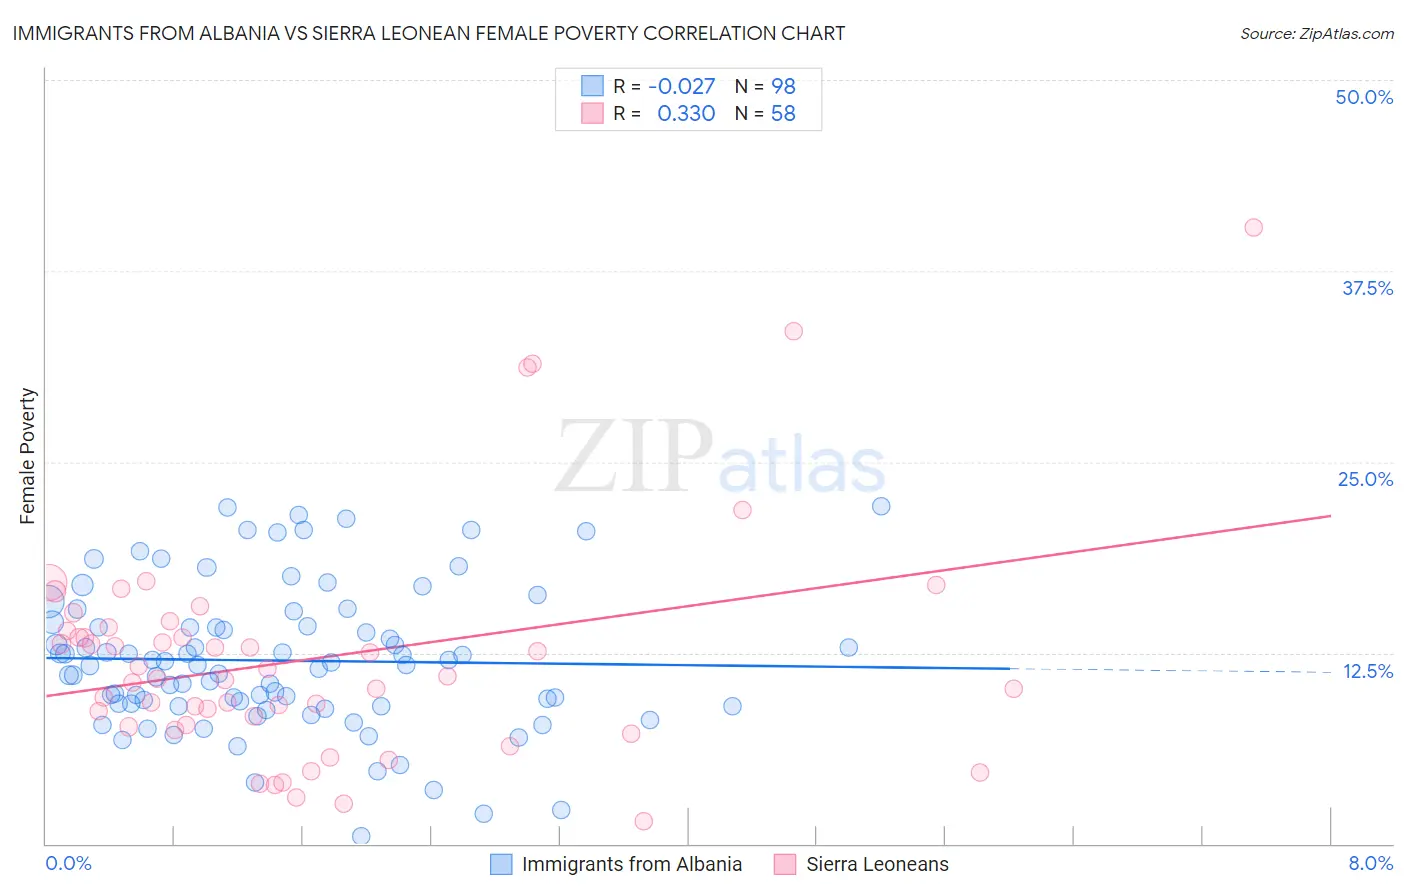
Immigrants from Albania vs Sierra Leonean Female Poverty Correlation Chart
The statistical analysis conducted on geographies consisting of 119,347,063 people shows no correlation between the proportion of Immigrants from Albania and poverty level among females in the United States with a correlation coefficient (R) of -0.027 and weighted average of 13.3%. Similarly, the statistical analysis conducted on geographies consisting of 83,350,076 people shows a mild positive correlation between the proportion of Sierra Leoneans and poverty level among females in the United States with a correlation coefficient (R) of 0.330 and weighted average of 13.7%, a difference of 2.9%.
Female Poverty Correlation Summary
| Measurement | Immigrants from Albania | Sierra Leonean |
| Minimum | 0.46% | 1.5% |
| Maximum | 22.1% | 40.4% |
| Range | 21.6% | 38.9% |
| Mean | 12.0% | 12.1% |
| Median | 11.7% | 10.9% |
| Interquartile 25% (IQ1) | 9.0% | 7.8% |
| Interquartile 75% (IQ3) | 14.3% | 13.9% |
| Interquartile Range (IQR) | 5.2% | 6.1% |
| Standard Deviation (Sample) | 4.7% | 7.4% |
| Standard Deviation (Population) | 4.7% | 7.4% |
Similar Demographics by Female Poverty
Demographics Similar to Immigrants from Albania by Female Poverty
In terms of female poverty, the demographic groups most similar to Immigrants from Albania are Guamanian/Chamorro (13.3%, a difference of 0.0%), Immigrants from Ethiopia (13.3%, a difference of 0.010%), Ethiopian (13.3%, a difference of 0.010%), Scotch-Irish (13.3%, a difference of 0.030%), and Immigrants from Nepal (13.3%, a difference of 0.040%).
| Demographics | Rating | Rank | Female Poverty |
| Immigrants | Bosnia and Herzegovina | 69.7 /100 | #156 | Good 13.2% |
| Immigrants | Northern Africa | 68.8 /100 | #157 | Good 13.2% |
| Pennsylvania Germans | 67.3 /100 | #158 | Good 13.2% |
| Costa Ricans | 63.6 /100 | #159 | Good 13.3% |
| Immigrants | Nepal | 62.7 /100 | #160 | Good 13.3% |
| Immigrants | Ethiopia | 62.5 /100 | #161 | Good 13.3% |
| Guamanians/Chamorros | 62.4 /100 | #162 | Good 13.3% |
| Immigrants | Albania | 62.4 /100 | #163 | Good 13.3% |
| Ethiopians | 62.3 /100 | #164 | Good 13.3% |
| Scotch-Irish | 62.1 /100 | #165 | Good 13.3% |
| Immigrants | Oceania | 59.7 /100 | #166 | Average 13.3% |
| Immigrants | Chile | 57.4 /100 | #167 | Average 13.3% |
| Aleuts | 56.7 /100 | #168 | Average 13.4% |
| Lebanese | 55.9 /100 | #169 | Average 13.4% |
| Colombians | 55.7 /100 | #170 | Average 13.4% |
Demographics Similar to Sierra Leoneans by Female Poverty
In terms of female poverty, the demographic groups most similar to Sierra Leoneans are Immigrants from Kuwait (13.7%, a difference of 0.040%), Immigrants from Costa Rica (13.7%, a difference of 0.13%), Iraqi (13.7%, a difference of 0.14%), Delaware (13.7%, a difference of 0.21%), and Immigrants from South America (13.7%, a difference of 0.27%).
| Demographics | Rating | Rank | Female Poverty |
| Kenyans | 43.8 /100 | #183 | Average 13.5% |
| Immigrants | Sierra Leone | 43.2 /100 | #184 | Average 13.5% |
| Immigrants | Cameroon | 42.0 /100 | #185 | Average 13.5% |
| Immigrants | Portugal | 41.5 /100 | #186 | Average 13.6% |
| Immigrants | Venezuela | 41.0 /100 | #187 | Average 13.6% |
| Hawaiians | 39.9 /100 | #188 | Fair 13.6% |
| Uruguayans | 39.8 /100 | #189 | Fair 13.6% |
| Sierra Leoneans | 33.1 /100 | #190 | Fair 13.7% |
| Immigrants | Kuwait | 32.7 /100 | #191 | Fair 13.7% |
| Immigrants | Costa Rica | 31.9 /100 | #192 | Fair 13.7% |
| Iraqis | 31.8 /100 | #193 | Fair 13.7% |
| Delaware | 31.1 /100 | #194 | Fair 13.7% |
| Immigrants | South America | 30.6 /100 | #195 | Fair 13.7% |
| South American Indians | 28.9 /100 | #196 | Fair 13.7% |
| Arabs | 28.6 /100 | #197 | Fair 13.7% |