Immigrants from Albania vs Kiowa Male Poverty
COMPARE
Immigrants from Albania
Kiowa
Male Poverty
Male Poverty Comparison
Immigrants from Albania
Kiowa
11.1%
MALE POVERTY
55.3/ 100
METRIC RATING
166th/ 347
METRIC RANK
15.2%
MALE POVERTY
0.0/ 100
METRIC RATING
322nd/ 347
METRIC RANK
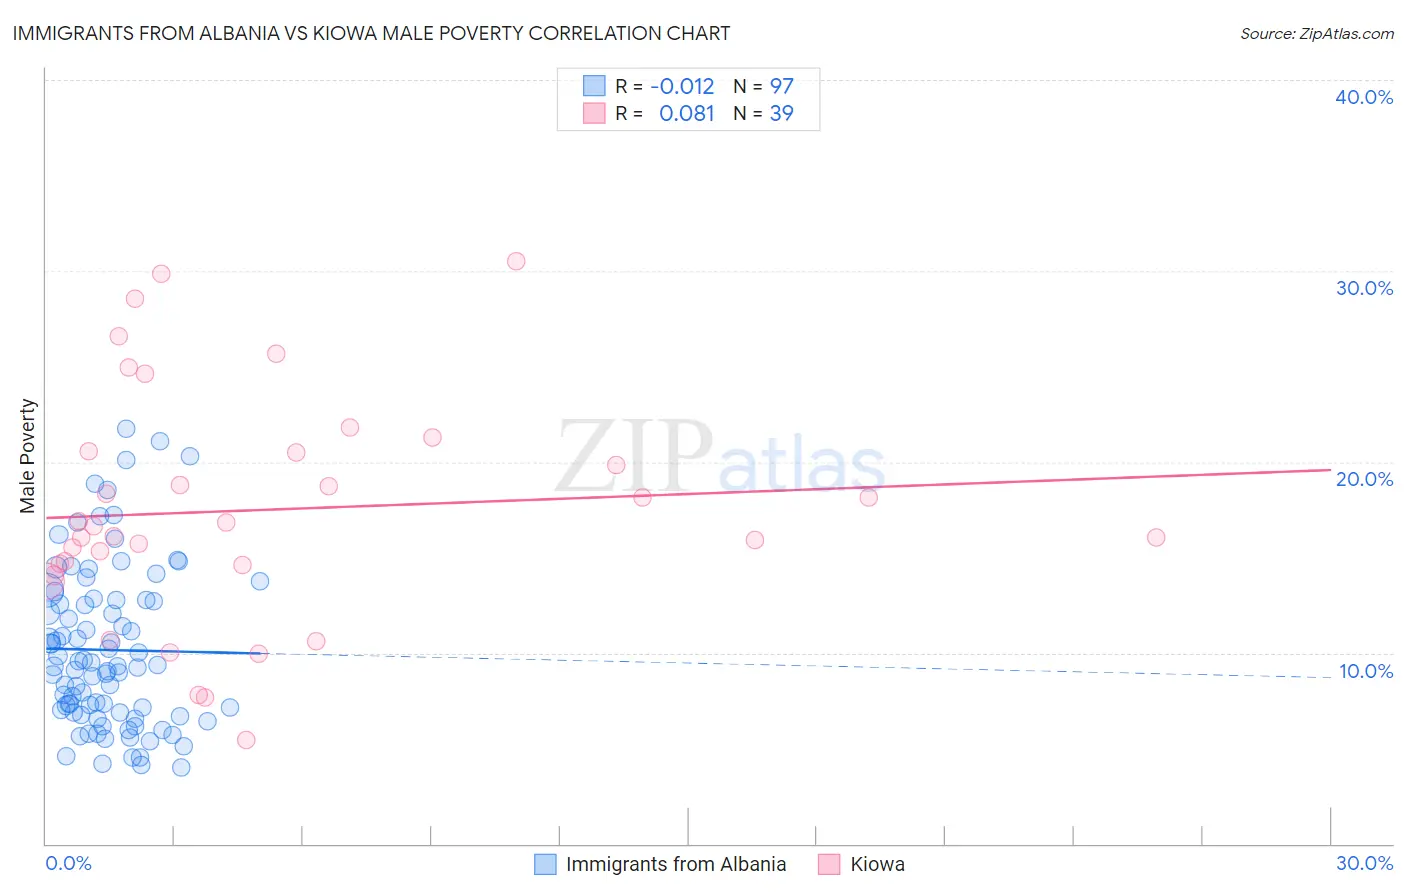
Immigrants from Albania vs Kiowa Male Poverty Correlation Chart
The statistical analysis conducted on geographies consisting of 119,357,125 people shows no correlation between the proportion of Immigrants from Albania and poverty level among males in the United States with a correlation coefficient (R) of -0.012 and weighted average of 11.1%. Similarly, the statistical analysis conducted on geographies consisting of 56,098,824 people shows a slight positive correlation between the proportion of Kiowa and poverty level among males in the United States with a correlation coefficient (R) of 0.081 and weighted average of 15.2%, a difference of 36.5%.
Male Poverty Correlation Summary
| Measurement | Immigrants from Albania | Kiowa |
| Minimum | 4.0% | 5.5% |
| Maximum | 21.8% | 30.5% |
| Range | 17.8% | 25.0% |
| Mean | 10.2% | 17.5% |
| Median | 9.3% | 16.7% |
| Interquartile 25% (IQ1) | 6.9% | 14.6% |
| Interquartile 75% (IQ3) | 12.8% | 20.6% |
| Interquartile Range (IQR) | 5.9% | 6.0% |
| Standard Deviation (Sample) | 4.2% | 6.0% |
| Standard Deviation (Population) | 4.2% | 5.9% |
Similar Demographics by Male Poverty
Demographics Similar to Immigrants from Albania by Male Poverty
In terms of male poverty, the demographic groups most similar to Immigrants from Albania are Immigrants from Spain (11.1%, a difference of 0.020%), Hungarian (11.1%, a difference of 0.020%), Immigrants from Portugal (11.1%, a difference of 0.040%), Immigrants from Colombia (11.1%, a difference of 0.11%), and White/Caucasian (11.1%, a difference of 0.14%).
| Demographics | Rating | Rank | Male Poverty |
| Taiwanese | 62.7 /100 | #159 | Good 11.0% |
| Soviet Union | 60.3 /100 | #160 | Good 11.1% |
| Immigrants | Northern Africa | 59.7 /100 | #161 | Average 11.1% |
| Immigrants | Chile | 57.4 /100 | #162 | Average 11.1% |
| Whites/Caucasians | 56.7 /100 | #163 | Average 11.1% |
| Ethiopians | 56.7 /100 | #164 | Average 11.1% |
| Immigrants | Spain | 55.5 /100 | #165 | Average 11.1% |
| Immigrants | Albania | 55.3 /100 | #166 | Average 11.1% |
| Hungarians | 55.1 /100 | #167 | Average 11.1% |
| Immigrants | Portugal | 54.9 /100 | #168 | Average 11.1% |
| Immigrants | Colombia | 54.2 /100 | #169 | Average 11.1% |
| South Americans | 53.8 /100 | #170 | Average 11.1% |
| Uruguayans | 51.0 /100 | #171 | Average 11.2% |
| Immigrants | Ethiopia | 50.7 /100 | #172 | Average 11.2% |
| Pennsylvania Germans | 50.5 /100 | #173 | Average 11.2% |
Demographics Similar to Kiowa by Male Poverty
In terms of male poverty, the demographic groups most similar to Kiowa are Colville (15.2%, a difference of 0.39%), Menominee (15.3%, a difference of 0.58%), Arapaho (15.1%, a difference of 0.72%), Yakama (15.3%, a difference of 0.76%), and Central American Indian (15.3%, a difference of 0.87%).
| Demographics | Rating | Rank | Male Poverty |
| Chippewa | 0.0 /100 | #315 | Tragic 14.6% |
| British West Indians | 0.0 /100 | #316 | Tragic 14.6% |
| Immigrants | Dominica | 0.0 /100 | #317 | Tragic 14.7% |
| Immigrants | Grenada | 0.0 /100 | #318 | Tragic 14.7% |
| U.S. Virgin Islanders | 0.0 /100 | #319 | Tragic 14.7% |
| Immigrants | Congo | 0.0 /100 | #320 | Tragic 14.7% |
| Arapaho | 0.0 /100 | #321 | Tragic 15.1% |
| Kiowa | 0.0 /100 | #322 | Tragic 15.2% |
| Colville | 0.0 /100 | #323 | Tragic 15.2% |
| Menominee | 0.0 /100 | #324 | Tragic 15.3% |
| Yakama | 0.0 /100 | #325 | Tragic 15.3% |
| Central American Indians | 0.0 /100 | #326 | Tragic 15.3% |
| Paiute | 0.0 /100 | #327 | Tragic 15.8% |
| Blacks/African Americans | 0.0 /100 | #328 | Tragic 15.8% |
| Dominicans | 0.0 /100 | #329 | Tragic 16.1% |