Immigrants from Albania vs Immigrants from Central America Male Poverty
COMPARE
Immigrants from Albania
Immigrants from Central America
Male Poverty
Male Poverty Comparison
Immigrants from Albania
Immigrants from Central America
11.1%
MALE POVERTY
55.3/ 100
METRIC RATING
166th/ 347
METRIC RANK
13.9%
MALE POVERTY
0.0/ 100
METRIC RATING
295th/ 347
METRIC RANK
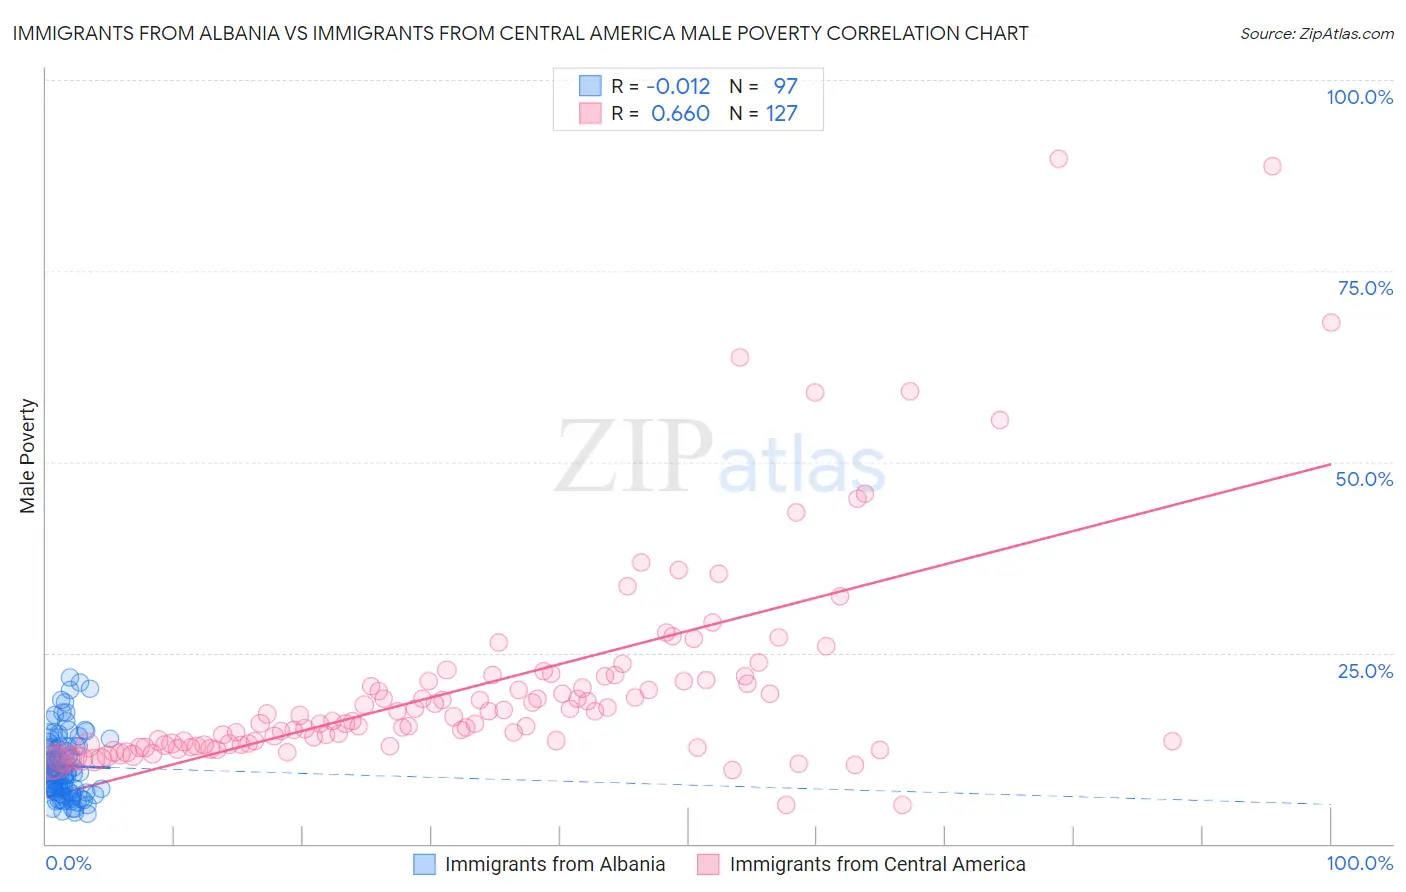
Immigrants from Albania vs Immigrants from Central America Male Poverty Correlation Chart
The statistical analysis conducted on geographies consisting of 119,357,125 people shows no correlation between the proportion of Immigrants from Albania and poverty level among males in the United States with a correlation coefficient (R) of -0.012 and weighted average of 11.1%. Similarly, the statistical analysis conducted on geographies consisting of 535,621,488 people shows a significant positive correlation between the proportion of Immigrants from Central America and poverty level among males in the United States with a correlation coefficient (R) of 0.660 and weighted average of 13.9%, a difference of 24.8%.
Male Poverty Correlation Summary
| Measurement | Immigrants from Albania | Immigrants from Central America |
| Minimum | 4.0% | 5.0% |
| Maximum | 21.8% | 89.7% |
| Range | 17.8% | 84.7% |
| Mean | 10.2% | 20.6% |
| Median | 9.3% | 16.1% |
| Interquartile 25% (IQ1) | 6.9% | 12.9% |
| Interquartile 75% (IQ3) | 12.8% | 21.5% |
| Interquartile Range (IQR) | 5.9% | 8.5% |
| Standard Deviation (Sample) | 4.2% | 14.1% |
| Standard Deviation (Population) | 4.2% | 14.0% |
Similar Demographics by Male Poverty
Demographics Similar to Immigrants from Albania by Male Poverty
In terms of male poverty, the demographic groups most similar to Immigrants from Albania are Immigrants from Spain (11.1%, a difference of 0.020%), Hungarian (11.1%, a difference of 0.020%), Immigrants from Portugal (11.1%, a difference of 0.040%), Immigrants from Colombia (11.1%, a difference of 0.11%), and White/Caucasian (11.1%, a difference of 0.14%).
| Demographics | Rating | Rank | Male Poverty |
| Taiwanese | 62.7 /100 | #159 | Good 11.0% |
| Soviet Union | 60.3 /100 | #160 | Good 11.1% |
| Immigrants | Northern Africa | 59.7 /100 | #161 | Average 11.1% |
| Immigrants | Chile | 57.4 /100 | #162 | Average 11.1% |
| Whites/Caucasians | 56.7 /100 | #163 | Average 11.1% |
| Ethiopians | 56.7 /100 | #164 | Average 11.1% |
| Immigrants | Spain | 55.5 /100 | #165 | Average 11.1% |
| Immigrants | Albania | 55.3 /100 | #166 | Average 11.1% |
| Hungarians | 55.1 /100 | #167 | Average 11.1% |
| Immigrants | Portugal | 54.9 /100 | #168 | Average 11.1% |
| Immigrants | Colombia | 54.2 /100 | #169 | Average 11.1% |
| South Americans | 53.8 /100 | #170 | Average 11.1% |
| Uruguayans | 51.0 /100 | #171 | Average 11.2% |
| Immigrants | Ethiopia | 50.7 /100 | #172 | Average 11.2% |
| Pennsylvania Germans | 50.5 /100 | #173 | Average 11.2% |
Demographics Similar to Immigrants from Central America by Male Poverty
In terms of male poverty, the demographic groups most similar to Immigrants from Central America are Cajun (13.9%, a difference of 0.11%), Hispanic or Latino (13.9%, a difference of 0.28%), Immigrants from Belize (13.8%, a difference of 0.34%), Indonesian (13.8%, a difference of 0.35%), and Vietnamese (13.8%, a difference of 0.52%).
| Demographics | Rating | Rank | Male Poverty |
| Immigrants | St. Vincent and the Grenadines | 0.0 /100 | #288 | Tragic 13.8% |
| Guatemalans | 0.0 /100 | #289 | Tragic 13.8% |
| Immigrants | Zaire | 0.0 /100 | #290 | Tragic 13.8% |
| Vietnamese | 0.0 /100 | #291 | Tragic 13.8% |
| Indonesians | 0.0 /100 | #292 | Tragic 13.8% |
| Immigrants | Belize | 0.0 /100 | #293 | Tragic 13.8% |
| Hispanics or Latinos | 0.0 /100 | #294 | Tragic 13.9% |
| Immigrants | Central America | 0.0 /100 | #295 | Tragic 13.9% |
| Cajuns | 0.0 /100 | #296 | Tragic 13.9% |
| Inupiat | 0.0 /100 | #297 | Tragic 14.0% |
| Blackfeet | 0.0 /100 | #298 | Tragic 14.0% |
| Immigrants | Guatemala | 0.0 /100 | #299 | Tragic 14.0% |
| Immigrants | Mexico | 0.0 /100 | #300 | Tragic 14.0% |
| Immigrants | Senegal | 0.0 /100 | #301 | Tragic 14.0% |
| Immigrants | Caribbean | 0.0 /100 | #302 | Tragic 14.0% |