Immigrants from Albania vs Immigrants from Sierra Leone Male Poverty
COMPARE
Immigrants from Albania
Immigrants from Sierra Leone
Male Poverty
Male Poverty Comparison
Immigrants from Albania
Immigrants from Sierra Leone
11.1%
MALE POVERTY
55.3/ 100
METRIC RATING
166th/ 347
METRIC RANK
11.4%
MALE POVERTY
32.9/ 100
METRIC RATING
186th/ 347
METRIC RANK
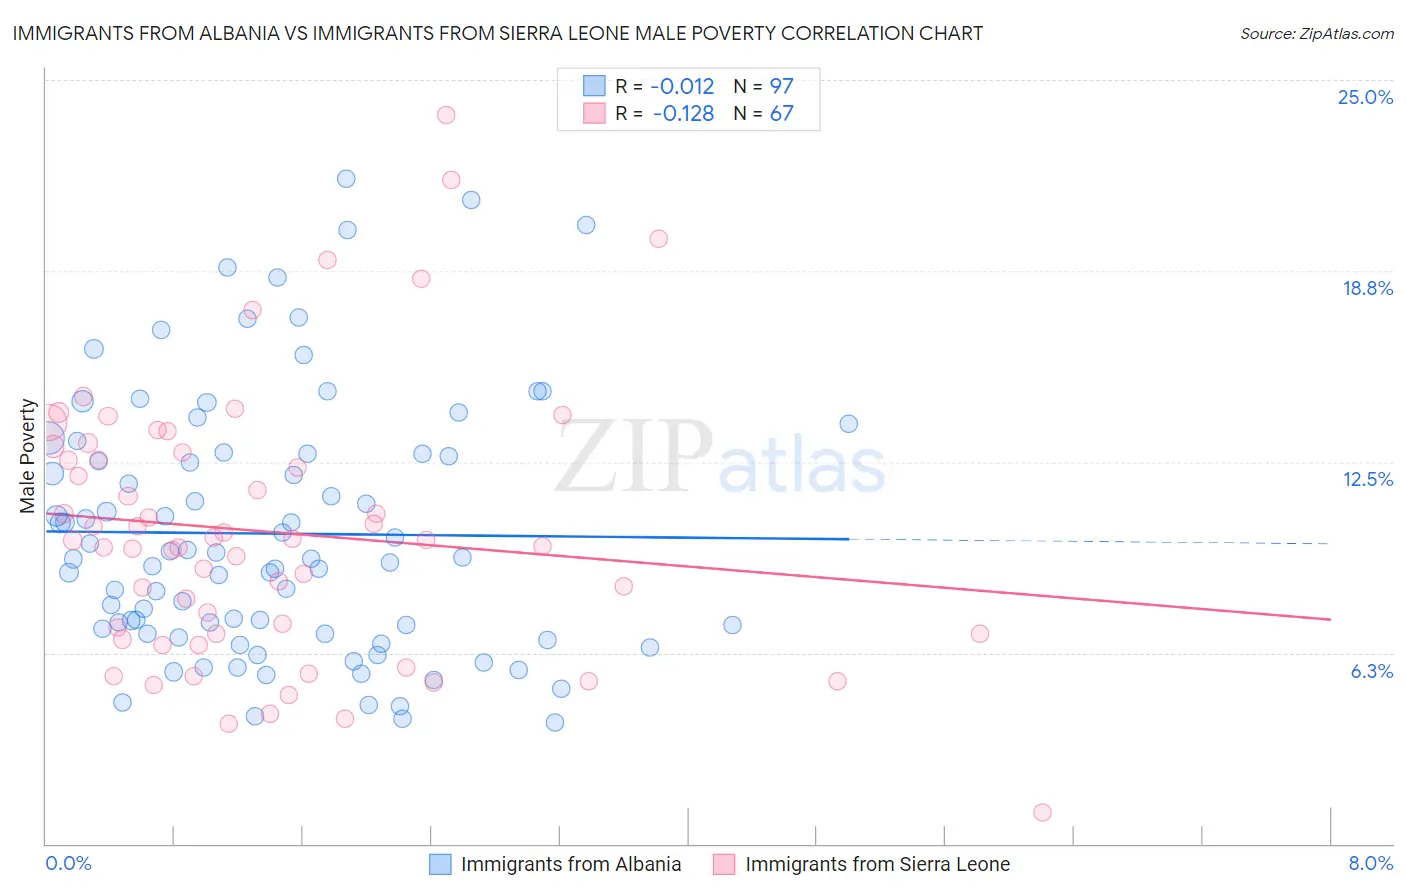
Immigrants from Albania vs Immigrants from Sierra Leone Male Poverty Correlation Chart
The statistical analysis conducted on geographies consisting of 119,357,125 people shows no correlation between the proportion of Immigrants from Albania and poverty level among males in the United States with a correlation coefficient (R) of -0.012 and weighted average of 11.1%. Similarly, the statistical analysis conducted on geographies consisting of 101,636,986 people shows a poor negative correlation between the proportion of Immigrants from Sierra Leone and poverty level among males in the United States with a correlation coefficient (R) of -0.128 and weighted average of 11.4%, a difference of 2.3%.
Male Poverty Correlation Summary
| Measurement | Immigrants from Albania | Immigrants from Sierra Leone |
| Minimum | 4.0% | 1.0% |
| Maximum | 21.8% | 23.8% |
| Range | 17.8% | 22.8% |
| Mean | 10.2% | 10.2% |
| Median | 9.3% | 9.9% |
| Interquartile 25% (IQ1) | 6.9% | 6.9% |
| Interquartile 75% (IQ3) | 12.8% | 12.8% |
| Interquartile Range (IQR) | 5.9% | 5.9% |
| Standard Deviation (Sample) | 4.2% | 4.4% |
| Standard Deviation (Population) | 4.2% | 4.4% |
Demographics Similar to Immigrants from Albania and Immigrants from Sierra Leone by Male Poverty
In terms of male poverty, the demographic groups most similar to Immigrants from Albania are Hungarian (11.1%, a difference of 0.020%), Immigrants from Portugal (11.1%, a difference of 0.040%), Immigrants from Colombia (11.1%, a difference of 0.11%), South American (11.1%, a difference of 0.15%), and Uruguayan (11.2%, a difference of 0.42%). Similarly, the demographic groups most similar to Immigrants from Sierra Leone are Immigrants from Afghanistan (11.4%, a difference of 0.050%), Immigrants from South America (11.3%, a difference of 0.43%), Kenyan (11.3%, a difference of 0.59%), Mongolian (11.3%, a difference of 0.65%), and Immigrants from Costa Rica (11.3%, a difference of 0.70%).
| Demographics | Rating | Rank | Male Poverty |
| Immigrants | Albania | 55.3 /100 | #166 | Average 11.1% |
| Hungarians | 55.1 /100 | #167 | Average 11.1% |
| Immigrants | Portugal | 54.9 /100 | #168 | Average 11.1% |
| Immigrants | Colombia | 54.2 /100 | #169 | Average 11.1% |
| South Americans | 53.8 /100 | #170 | Average 11.1% |
| Uruguayans | 51.0 /100 | #171 | Average 11.2% |
| Immigrants | Ethiopia | 50.7 /100 | #172 | Average 11.2% |
| Pennsylvania Germans | 50.5 /100 | #173 | Average 11.2% |
| Immigrants | Oceania | 50.0 /100 | #174 | Average 11.2% |
| Celtics | 47.5 /100 | #175 | Average 11.2% |
| Immigrants | Fiji | 46.0 /100 | #176 | Average 11.2% |
| Lebanese | 45.6 /100 | #177 | Average 11.2% |
| Immigrants | Cameroon | 44.5 /100 | #178 | Average 11.2% |
| Immigrants | Syria | 40.3 /100 | #179 | Average 11.3% |
| Immigrants | Morocco | 40.1 /100 | #180 | Average 11.3% |
| Immigrants | Costa Rica | 39.5 /100 | #181 | Fair 11.3% |
| Mongolians | 39.0 /100 | #182 | Fair 11.3% |
| Kenyans | 38.4 /100 | #183 | Fair 11.3% |
| Immigrants | South America | 36.9 /100 | #184 | Fair 11.3% |
| Immigrants | Afghanistan | 33.3 /100 | #185 | Fair 11.4% |
| Immigrants | Sierra Leone | 32.9 /100 | #186 | Fair 11.4% |