Immigrants from Albania vs European Male Poverty
COMPARE
Immigrants from Albania
European
Male Poverty
Male Poverty Comparison
Immigrants from Albania
Europeans
11.1%
MALE POVERTY
55.3/ 100
METRIC RATING
166th/ 347
METRIC RANK
10.2%
MALE POVERTY
97.1/ 100
METRIC RATING
71st/ 347
METRIC RANK
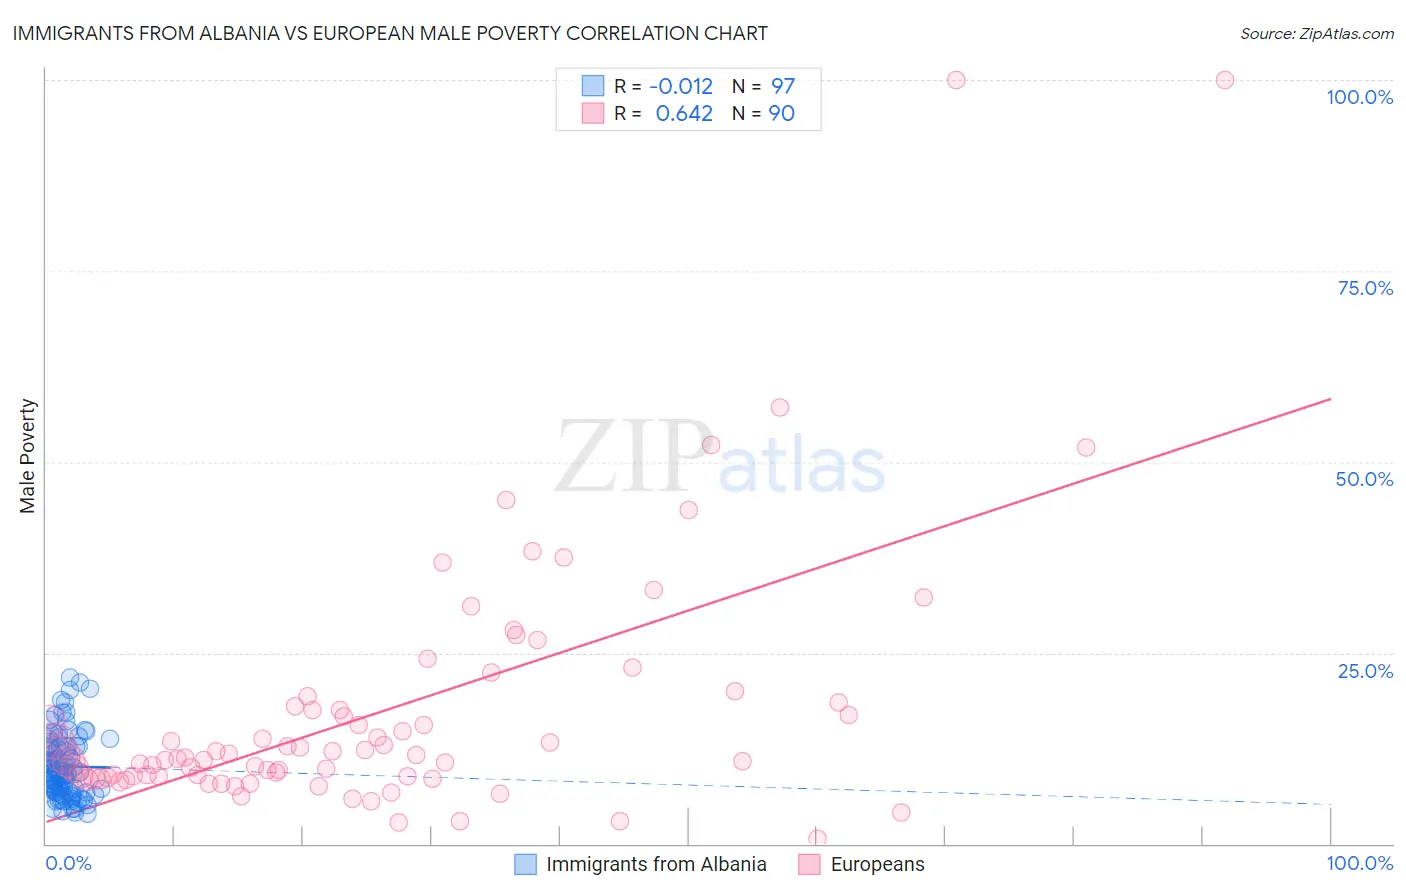
Immigrants from Albania vs European Male Poverty Correlation Chart
The statistical analysis conducted on geographies consisting of 119,357,125 people shows no correlation between the proportion of Immigrants from Albania and poverty level among males in the United States with a correlation coefficient (R) of -0.012 and weighted average of 11.1%. Similarly, the statistical analysis conducted on geographies consisting of 560,421,320 people shows a significant positive correlation between the proportion of Europeans and poverty level among males in the United States with a correlation coefficient (R) of 0.642 and weighted average of 10.2%, a difference of 8.8%.
Male Poverty Correlation Summary
| Measurement | Immigrants from Albania | European |
| Minimum | 4.0% | 0.73% |
| Maximum | 21.8% | 100.0% |
| Range | 17.8% | 99.3% |
| Mean | 10.2% | 17.4% |
| Median | 9.3% | 11.4% |
| Interquartile 25% (IQ1) | 6.9% | 8.8% |
| Interquartile 75% (IQ3) | 12.8% | 18.1% |
| Interquartile Range (IQR) | 5.9% | 9.3% |
| Standard Deviation (Sample) | 4.2% | 17.0% |
| Standard Deviation (Population) | 4.2% | 16.9% |
Similar Demographics by Male Poverty
Demographics Similar to Immigrants from Albania by Male Poverty
In terms of male poverty, the demographic groups most similar to Immigrants from Albania are Immigrants from Spain (11.1%, a difference of 0.020%), Hungarian (11.1%, a difference of 0.020%), Immigrants from Portugal (11.1%, a difference of 0.040%), Immigrants from Colombia (11.1%, a difference of 0.11%), and White/Caucasian (11.1%, a difference of 0.14%).
| Demographics | Rating | Rank | Male Poverty |
| Taiwanese | 62.7 /100 | #159 | Good 11.0% |
| Soviet Union | 60.3 /100 | #160 | Good 11.1% |
| Immigrants | Northern Africa | 59.7 /100 | #161 | Average 11.1% |
| Immigrants | Chile | 57.4 /100 | #162 | Average 11.1% |
| Whites/Caucasians | 56.7 /100 | #163 | Average 11.1% |
| Ethiopians | 56.7 /100 | #164 | Average 11.1% |
| Immigrants | Spain | 55.5 /100 | #165 | Average 11.1% |
| Immigrants | Albania | 55.3 /100 | #166 | Average 11.1% |
| Hungarians | 55.1 /100 | #167 | Average 11.1% |
| Immigrants | Portugal | 54.9 /100 | #168 | Average 11.1% |
| Immigrants | Colombia | 54.2 /100 | #169 | Average 11.1% |
| South Americans | 53.8 /100 | #170 | Average 11.1% |
| Uruguayans | 51.0 /100 | #171 | Average 11.2% |
| Immigrants | Ethiopia | 50.7 /100 | #172 | Average 11.2% |
| Pennsylvania Germans | 50.5 /100 | #173 | Average 11.2% |
Demographics Similar to Europeans by Male Poverty
In terms of male poverty, the demographic groups most similar to Europeans are Immigrants from Canada (10.2%, a difference of 0.010%), Paraguayan (10.2%, a difference of 0.030%), Immigrants from Australia (10.2%, a difference of 0.040%), Immigrants from Asia (10.2%, a difference of 0.090%), and Immigrants from Eastern Europe (10.2%, a difference of 0.16%).
| Demographics | Rating | Rank | Male Poverty |
| Swiss | 97.5 /100 | #64 | Exceptional 10.2% |
| Zimbabweans | 97.5 /100 | #65 | Exceptional 10.2% |
| Serbians | 97.5 /100 | #66 | Exceptional 10.2% |
| Immigrants | Netherlands | 97.3 /100 | #67 | Exceptional 10.2% |
| Immigrants | Sri Lanka | 97.2 /100 | #68 | Exceptional 10.2% |
| Immigrants | Australia | 97.1 /100 | #69 | Exceptional 10.2% |
| Paraguayans | 97.1 /100 | #70 | Exceptional 10.2% |
| Europeans | 97.1 /100 | #71 | Exceptional 10.2% |
| Immigrants | Canada | 97.1 /100 | #72 | Exceptional 10.2% |
| Immigrants | Asia | 97.0 /100 | #73 | Exceptional 10.2% |
| Immigrants | Eastern Europe | 96.9 /100 | #74 | Exceptional 10.2% |
| Carpatho Rusyns | 96.9 /100 | #75 | Exceptional 10.2% |
| Dutch | 96.9 /100 | #76 | Exceptional 10.2% |
| Immigrants | Belgium | 96.8 /100 | #77 | Exceptional 10.3% |
| Irish | 96.8 /100 | #78 | Exceptional 10.3% |