Immigrants from Africa vs Salvadoran Female Poverty
COMPARE
Immigrants from Africa
Salvadoran
Female Poverty
Female Poverty Comparison
Immigrants from Africa
Salvadorans
14.5%
FEMALE POVERTY
3.3/ 100
METRIC RATING
223rd/ 347
METRIC RANK
15.3%
FEMALE POVERTY
0.3/ 100
METRIC RATING
249th/ 347
METRIC RANK
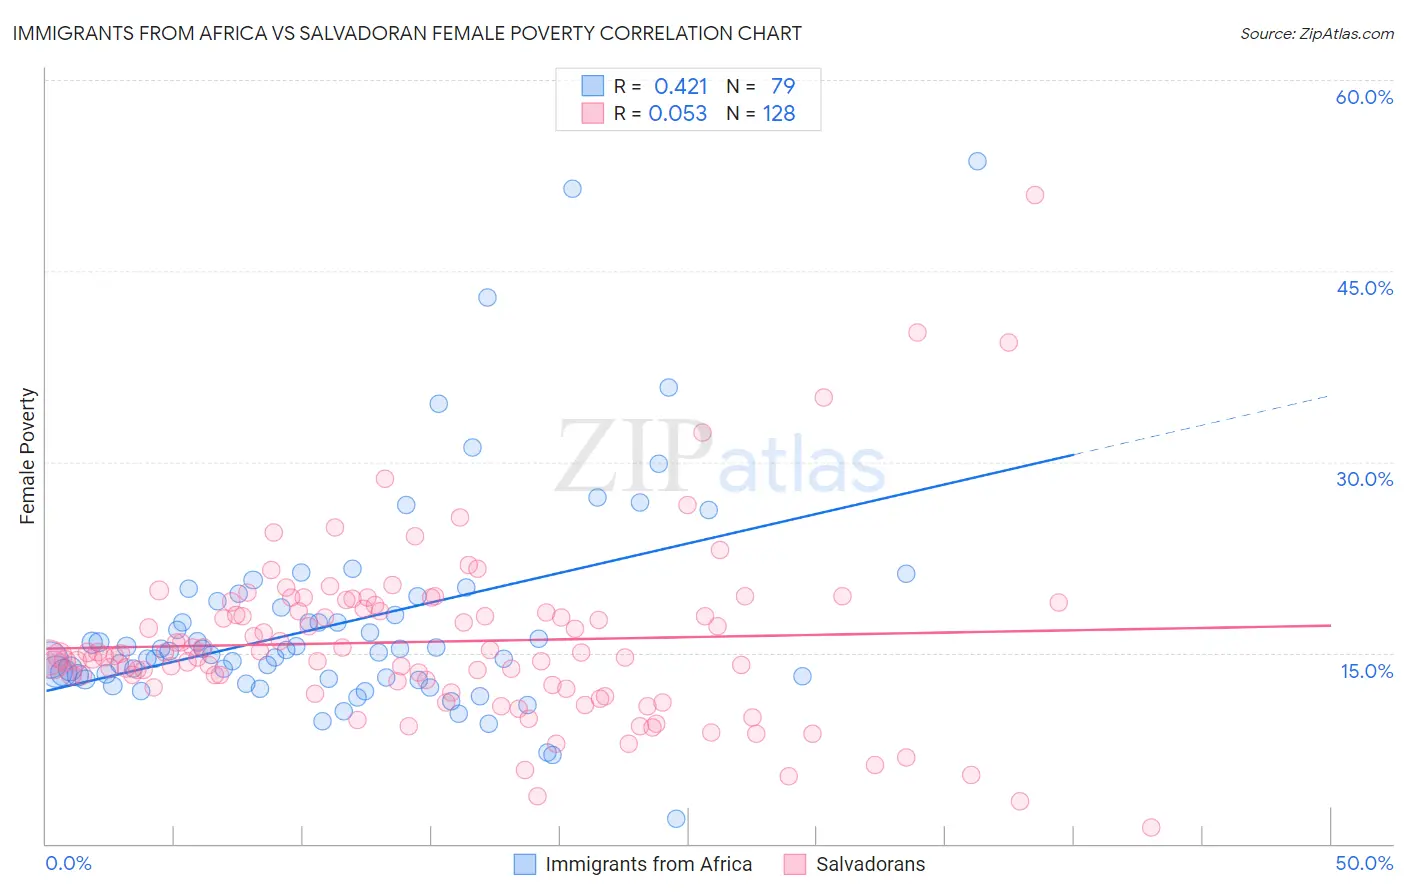
Immigrants from Africa vs Salvadoran Female Poverty Correlation Chart
The statistical analysis conducted on geographies consisting of 468,810,644 people shows a moderate positive correlation between the proportion of Immigrants from Africa and poverty level among females in the United States with a correlation coefficient (R) of 0.421 and weighted average of 14.5%. Similarly, the statistical analysis conducted on geographies consisting of 398,655,447 people shows a slight positive correlation between the proportion of Salvadorans and poverty level among females in the United States with a correlation coefficient (R) of 0.053 and weighted average of 15.3%, a difference of 5.5%.
Female Poverty Correlation Summary
| Measurement | Immigrants from Africa | Salvadoran |
| Minimum | 1.9% | 1.3% |
| Maximum | 53.6% | 50.9% |
| Range | 51.7% | 49.7% |
| Mean | 17.4% | 15.9% |
| Median | 15.1% | 14.9% |
| Interquartile 25% (IQ1) | 12.9% | 12.3% |
| Interquartile 75% (IQ3) | 19.0% | 18.6% |
| Interquartile Range (IQR) | 6.1% | 6.3% |
| Standard Deviation (Sample) | 8.7% | 6.9% |
| Standard Deviation (Population) | 8.6% | 6.9% |
Similar Demographics by Female Poverty
Demographics Similar to Immigrants from Africa by Female Poverty
In terms of female poverty, the demographic groups most similar to Immigrants from Africa are Nonimmigrants (14.5%, a difference of 0.23%), Immigrants from Cambodia (14.5%, a difference of 0.26%), American (14.6%, a difference of 0.39%), Immigrants from Micronesia (14.6%, a difference of 0.40%), and Alsatian (14.5%, a difference of 0.45%).
| Demographics | Rating | Rank | Female Poverty |
| Immigrants | Thailand | 4.5 /100 | #216 | Tragic 14.4% |
| Immigrants | Immigrants | 4.5 /100 | #217 | Tragic 14.4% |
| Immigrants | Uzbekistan | 4.4 /100 | #218 | Tragic 14.4% |
| Japanese | 4.1 /100 | #219 | Tragic 14.5% |
| Alsatians | 4.0 /100 | #220 | Tragic 14.5% |
| Immigrants | Cambodia | 3.7 /100 | #221 | Tragic 14.5% |
| Immigrants | Nonimmigrants | 3.7 /100 | #222 | Tragic 14.5% |
| Immigrants | Africa | 3.3 /100 | #223 | Tragic 14.5% |
| Americans | 2.8 /100 | #224 | Tragic 14.6% |
| Immigrants | Micronesia | 2.8 /100 | #225 | Tragic 14.6% |
| Immigrants | Eritrea | 2.4 /100 | #226 | Tragic 14.6% |
| Immigrants | Nigeria | 2.1 /100 | #227 | Tragic 14.7% |
| German Russians | 2.0 /100 | #228 | Tragic 14.7% |
| Ghanaians | 1.9 /100 | #229 | Tragic 14.7% |
| Alaska Natives | 1.8 /100 | #230 | Tragic 14.7% |
Demographics Similar to Salvadorans by Female Poverty
In terms of female poverty, the demographic groups most similar to Salvadorans are Immigrants from Western Africa (15.3%, a difference of 0.040%), Potawatomi (15.3%, a difference of 0.14%), Immigrants from Ghana (15.3%, a difference of 0.14%), Cuban (15.3%, a difference of 0.15%), and Spanish American Indian (15.3%, a difference of 0.20%).
| Demographics | Rating | Rank | Female Poverty |
| Nepalese | 0.4 /100 | #242 | Tragic 15.2% |
| Nicaraguans | 0.3 /100 | #243 | Tragic 15.3% |
| Ecuadorians | 0.3 /100 | #244 | Tragic 15.3% |
| Spanish American Indians | 0.3 /100 | #245 | Tragic 15.3% |
| Cubans | 0.3 /100 | #246 | Tragic 15.3% |
| Potawatomi | 0.3 /100 | #247 | Tragic 15.3% |
| Immigrants | Ghana | 0.3 /100 | #248 | Tragic 15.3% |
| Salvadorans | 0.3 /100 | #249 | Tragic 15.3% |
| Immigrants | Western Africa | 0.3 /100 | #250 | Tragic 15.3% |
| Immigrants | Trinidad and Tobago | 0.3 /100 | #251 | Tragic 15.4% |
| Immigrants | Burma/Myanmar | 0.3 /100 | #252 | Tragic 15.4% |
| Liberians | 0.2 /100 | #253 | Tragic 15.4% |
| Trinidadians and Tobagonians | 0.2 /100 | #254 | Tragic 15.4% |
| Ottawa | 0.2 /100 | #255 | Tragic 15.5% |
| Jamaicans | 0.2 /100 | #256 | Tragic 15.5% |