Icelander vs Immigrants from Lebanon Self-Care Disability

COMPARE

Icelander
Race
Ancestry
AfghanAfricanAlaska NativeAlaskan AthabascanAlbanianAleutAlsatianAmericanApacheArabArapahoArgentineanArmenianAssyrian/Chaldean/SyriacAustralianAustrianBahamianBangladeshiBarbadianBasqueBelgianBelizeanBermudanBhutaneseBlackfeetBolivianBrazilianBritishBritish West IndianBulgarianBurmeseCajunCambodianCanadianCape VerdeanCarpatho RusynCelticCentral AmericanCentral American IndianCherokeeCheyenneChickasawChileanChineseChippewaChoctawColombianColvilleComancheCosta RicanCreeCreekCroatianCrowCubanCypriotCzechCzechoslovakianDanishDelawareDominicanDutchDutch West IndianEastern EuropeanEcuadorianEgyptianEnglishEstonianEthiopianEuropeanFijianFilipinoFinnishFrenchFrench American IndianFrench CanadianGermanGerman RussianGhanaianGreekGuamanian/ChamorroGuatemalanGuyaneseHaitianHmongHonduranHopiHoumaHungarianIcelanderIndian (Asian)IndonesianInupiatIranianIraqiIrishIroquoisIsraeliItalianJamaicanJapaneseJordanianKenyanKiowaKoreanLaotianLatvianLebaneseLiberianLithuanianLumbeeLuxembourgerMacedonianMalaysianMalteseMarshalleseMenomineeMexicanMexican American IndianMongolianMoroccanNative HawaiianNavajoNepaleseNew ZealanderNicaraguanNigerianNorthern EuropeanNorwegianOkinawanOsageOttawaPaiutePakistaniPalestinianPanamanianParaguayanPennsylvania GermanPeruvianPimaPolishPortuguesePotawatomiPuebloPuerto RicanPuget Sound SalishRomanianRussianSalvadoranSamoanScandinavianScotch-IrishScottishSeminoleSenegaleseSerbianShoshoneSierra LeoneanSiouxSlavicSlovakSloveneSomaliSouth AfricanSouth AmericanSouth American IndianSoviet UnionSpaniardSpanishSpanish AmericanSpanish American IndianSri LankanSubsaharan AfricanSudaneseSwedishSwissSyrianTaiwaneseThaiTlingit-HaidaTohono O'OdhamTonganTrinidadian and TobagonianTsimshianTurkishU.S. Virgin IslanderUgandanUkrainianUruguayanUteVenezuelanVietnameseWelshWest IndianYakamaYaquiYugoslavianYumanYup'ikZimbabwean
Immigration
NonimmigrantsImmigrantsAfghanistanAfricaAlbaniaArgentinaArmeniaAsiaAustraliaAustriaBahamasBangladeshBarbadosBelarusBelgiumBelizeBoliviaBosnia and HerzegovinaBrazilBulgariaBurma/MyanmarCabo VerdeCambodiaCameroonCanadaCaribbeanCentral AmericaChileChinaColombiaCongoCosta RicaCroatiaCubaCzechoslovakiaDenmarkDominicaDominican RepublicEastern AfricaEastern AsiaEastern EuropeEcuadorEgyptEl SalvadorEnglandEritreaEthiopiaEuropeFijiFranceGermanyGhanaGreeceGrenadaGuatemalaGuyanaHaitiHondurasHong KongHungaryIndiaIndonesiaIranIraqIrelandIsraelItalyJamaicaJapanJordanKazakhstanKenyaKoreaKuwaitLaosLatin AmericaLatviaLiberiaLithuaniaMalaysiaMexicoMicronesiaMiddle AfricaMoldovaMoroccoNepalNetherlandsNicaraguaNigeriaNorth AmericaNorth MacedoniaNorthern AfricaNorthern EuropeNorwayOceaniaPakistanPanamaPeruPhilippinesPolandPortugalRomaniaRussiaSaudi ArabiaScotlandSenegalSerbiaSierra LeoneSingaporeSomaliaSouth AfricaSouth AmericaSouth Central AsiaSouth Eastern AsiaSouthern EuropeSpainSri LankaSt. Vincent and the GrenadinesSudanSwedenSwitzerlandSyriaTaiwanThailandTrinidad and TobagoTurkeyUgandaUkraineUruguayUzbekistanVenezuelaVietnamWest IndiesWestern AfricaWestern AsiaWestern EuropeYemenZaireZimbabweAzores
Immigrants from Lebanon
Race
Ancestry
AfghanAfricanAlaska NativeAlaskan AthabascanAlbanianAleutAlsatianAmericanApacheArabArapahoArgentineanArmenianAssyrian/Chaldean/SyriacAustralianAustrianBahamianBangladeshiBarbadianBasqueBelgianBelizeanBermudanBhutaneseBlackfeetBolivianBrazilianBritishBritish West IndianBulgarianBurmeseCajunCambodianCanadianCape VerdeanCarpatho RusynCelticCentral AmericanCentral American IndianCherokeeCheyenneChickasawChileanChineseChippewaChoctawColombianColvilleComancheCosta RicanCreeCreekCroatianCrowCubanCypriotCzechCzechoslovakianDanishDelawareDominicanDutchDutch West IndianEastern EuropeanEcuadorianEgyptianEnglishEstonianEthiopianEuropeanFijianFilipinoFinnishFrenchFrench American IndianFrench CanadianGermanGerman RussianGhanaianGreekGuamanian/ChamorroGuatemalanGuyaneseHaitianHmongHonduranHopiHoumaHungarianIndian (Asian)IndonesianInupiatIranianIraqiIrishIroquoisIsraeliItalianJamaicanJapaneseJordanianKenyanKiowaKoreanLaotianLatvianLebaneseLiberianLithuanianLumbeeLuxembourgerMacedonianMalaysianMalteseMarshalleseMenomineeMexicanMexican American IndianMongolianMoroccanNative HawaiianNavajoNepaleseNew ZealanderNicaraguanNigerianNorthern EuropeanNorwegianOkinawanOsageOttawaPaiutePakistaniPalestinianPanamanianParaguayanPennsylvania GermanPeruvianPimaPolishPortuguesePotawatomiPuebloPuerto RicanPuget Sound SalishRomanianRussianSalvadoranSamoanScandinavianScotch-IrishScottishSeminoleSenegaleseSerbianShoshoneSierra LeoneanSiouxSlavicSlovakSloveneSomaliSouth AfricanSouth AmericanSouth American IndianSoviet UnionSpaniardSpanishSpanish AmericanSpanish American IndianSri LankanSubsaharan AfricanSudaneseSwedishSwissSyrianTaiwaneseThaiTlingit-HaidaTohono O'OdhamTonganTrinidadian and TobagonianTsimshianTurkishU.S. Virgin IslanderUgandanUkrainianUruguayanUteVenezuelanVietnameseWelshWest IndianYakamaYaquiYugoslavianYumanYup'ikZimbabwean
Immigration
NonimmigrantsImmigrantsAfghanistanAfricaAlbaniaArgentinaArmeniaAsiaAustraliaAustriaBahamasBangladeshBarbadosBelarusBelgiumBelizeBoliviaBosnia and HerzegovinaBrazilBulgariaBurma/MyanmarCabo VerdeCambodiaCameroonCanadaCaribbeanCentral AmericaChileChinaColombiaCongoCosta RicaCroatiaCubaCzechoslovakiaDenmarkDominicaDominican RepublicEastern AfricaEastern AsiaEastern EuropeEcuadorEgyptEl SalvadorEnglandEritreaEthiopiaEuropeFijiFranceGermanyGhanaGreeceGrenadaGuatemalaGuyanaHaitiHondurasHong KongHungaryIndiaIndonesiaIranIraqIrelandIsraelItalyJamaicaJapanJordanKazakhstanKenyaKoreaKuwaitLaosLatin AmericaLatviaLebanonLiberiaLithuaniaMalaysiaMexicoMicronesiaMiddle AfricaMoldovaMoroccoNepalNetherlandsNicaraguaNigeriaNorth AmericaNorth MacedoniaNorthern AfricaNorthern EuropeNorwayOceaniaPakistanPanamaPeruPhilippinesPolandPortugalRomaniaRussiaSaudi ArabiaScotlandSenegalSerbiaSierra LeoneSingaporeSomaliaSouth AfricaSouth AmericaSouth Central AsiaSouth Eastern AsiaSouthern EuropeSpainSri LankaSt. Vincent and the GrenadinesSudanSwedenSwitzerlandSyriaTaiwanThailandTrinidad and TobagoTurkeyUgandaUkraineUruguayUzbekistanVenezuelaVietnamWest IndiesWestern AfricaWestern AsiaWestern EuropeYemenZaireZimbabweAzores
Self-Care Disability
Income
Poverty
Unemployment
Labor Participation
Family Structure
Vehicle Availability
Education Level
Disability

Self-Care Disability Comparison

Icelanders

Immigrants from Lebanon

Exceptional
Poor
2.4%
SELF-CARE DISABILITY
97.4/ 100
METRIC RATING
92nd/ 347
METRIC RANK
2.5%
SELF-CARE DISABILITY
12.4/ 100
METRIC RATING
203rd/ 347
METRIC RANK

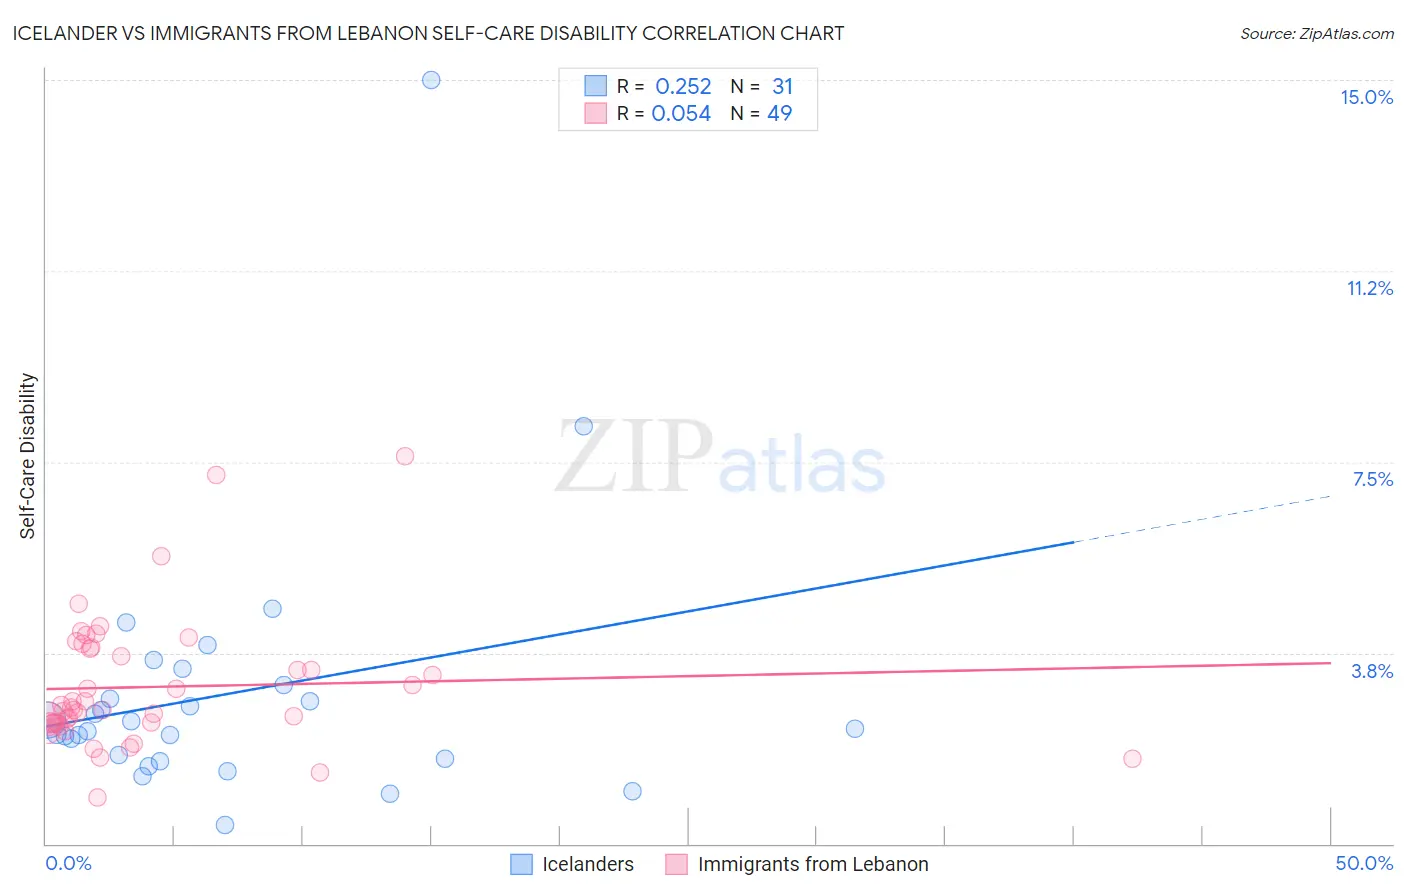
Icelander vs Immigrants from Lebanon Self-Care Disability Correlation Chart

The statistical analysis conducted on geographies consisting of 159,567,572 people shows a weak positive correlation between the proportion of Icelanders and percentage of population with self-care disability in the United States with a correlation coefficient (R) of 0.252 and weighted average of 2.4%. Similarly, the statistical analysis conducted on geographies consisting of 217,055,251 people shows a slight positive correlation between the proportion of Immigrants from Lebanon and percentage of population with self-care disability in the United States with a correlation coefficient (R) of 0.054 and weighted average of 2.5%, a difference of 7.0%.
Icelander vs Immigrants from Lebanon Self-Care Disability

Self-Care Disability Correlation Summary

MeasurementIcelanderImmigrants from Lebanon
Minimum0.38%0.92%
Maximum15.0%7.6%
Range14.6%6.7%
Mean2.9%3.1%
Median2.3%2.6%
Interquartile 25% (IQ1)1.7%2.4%
Interquartile 75% (IQ3)3.1%3.8%
Interquartile Range (IQR)1.4%1.5%
Standard Deviation (Sample)2.6%1.3%
Standard Deviation (Population)2.6%1.3%

Similar Demographics by Self-Care Disability

Demographics Similar to Icelanders by Self-Care Disability

In terms of self-care disability, the demographic groups most similar to Icelanders are Immigrants from Jordan (2.4%, a difference of 0.14%), Immigrants from Czechoslovakia (2.4%, a difference of 0.15%), Immigrants from Latvia (2.4%, a difference of 0.19%), Macedonian (2.4%, a difference of 0.24%), and Immigrants from Asia (2.4%, a difference of 0.25%).
DemographicsRating | RankSelf-Care Disability
Estonians
98.3
/100
|
#85
Exceptional
2.3%
Immigrants | Northern Africa
98.2
/100
|
#86
Exceptional
2.3%
Sierra Leoneans
98.0
/100
|
#87
Exceptional
2.4%
Lithuanians
98.0
/100
|
#88
Exceptional
2.4%
Immigrants | Congo
98.0
/100
|
#89
Exceptional
2.4%
Immigrants | Czechoslovakia
97.7
/100
|
#90
Exceptional
2.4%
Immigrants | Jordan
97.7
/100
|
#91
Exceptional
2.4%
Icelanders
97.4
/100
|
#92
Exceptional
2.4%
Immigrants | Latvia
97.0
/100
|
#93
Exceptional
2.4%
Macedonians
96.9
/100
|
#94
Exceptional
2.4%
Immigrants | Asia
96.9
/100
|
#95
Exceptional
2.4%
Immigrants | Chile
96.7
/100
|
#96
Exceptional
2.4%
Swiss
96.6
/100
|
#97
Exceptional
2.4%
Immigrants | Poland
96.4
/100
|
#98
Exceptional
2.4%
Immigrants | Israel
96.1
/100
|
#99
Exceptional
2.4%

Demographics Similar to Immigrants from Lebanon by Self-Care Disability

In terms of self-care disability, the demographic groups most similar to Immigrants from Lebanon are Slovak (2.5%, a difference of 0.020%), Immigrants from South Eastern Asia (2.5%, a difference of 0.050%), Immigrants from Bahamas (2.5%, a difference of 0.050%), Immigrants from Western Africa (2.5%, a difference of 0.090%), and Immigrants from Russia (2.5%, a difference of 0.15%).
DemographicsRating | RankSelf-Care Disability
Koreans
15.5
/100
|
#196
Poor
2.5%
Crow
15.2
/100
|
#197
Poor
2.5%
Immigrants | Immigrants
15.0
/100
|
#198
Poor
2.5%
Immigrants | Ghana
14.7
/100
|
#199
Poor
2.5%
Immigrants | Western Africa
13.3
/100
|
#200
Poor
2.5%
Immigrants | South Eastern Asia
12.9
/100
|
#201
Poor
2.5%
Slovaks
12.6
/100
|
#202
Poor
2.5%
Immigrants | Lebanon
12.4
/100
|
#203
Poor
2.5%
Immigrants | Bahamas
11.9
/100
|
#204
Poor
2.5%
Immigrants | Russia
11.0
/100
|
#205
Poor
2.5%
Alaskan Athabascans
10.4
/100
|
#206
Poor
2.5%
French
9.9
/100
|
#207
Tragic
2.5%
Central Americans
8.7
/100
|
#208
Tragic
2.5%
Malaysians
7.7
/100
|
#209
Tragic
2.5%
Panamanians
6.4
/100
|
#210
Tragic
2.5%