Immigrants from South America vs Immigrants from Jamaica Single Male Poverty
COMPARE
Immigrants from South America
Immigrants from Jamaica
Single Male Poverty
Single Male Poverty Comparison
Immigrants from South America
Immigrants from Jamaica
12.1%
SINGLE MALE POVERTY
98.7/ 100
METRIC RATING
81st/ 347
METRIC RANK
13.0%
SINGLE MALE POVERTY
26.5/ 100
METRIC RATING
192nd/ 347
METRIC RANK
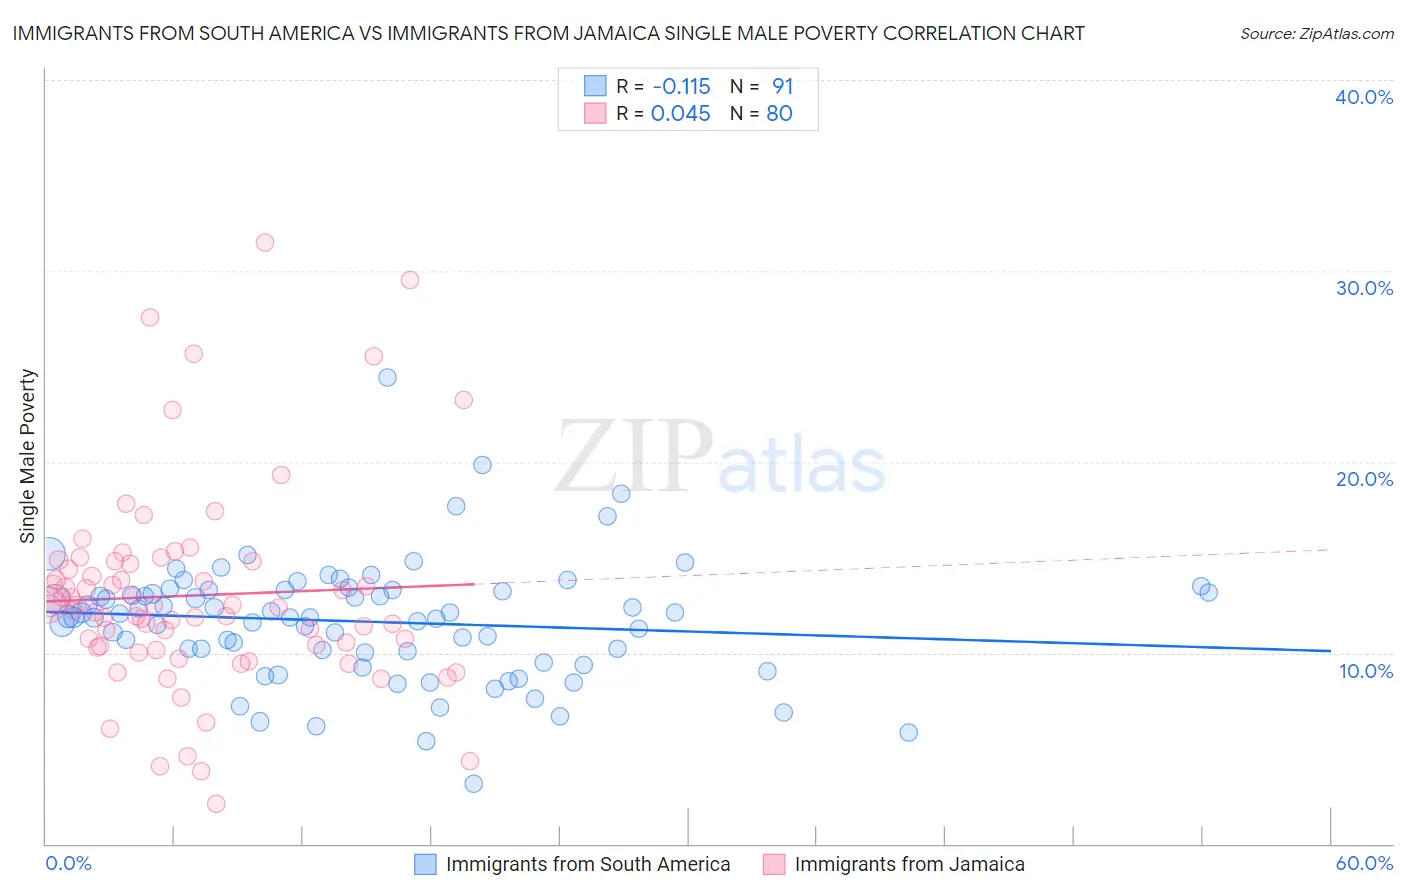
Immigrants from South America vs Immigrants from Jamaica Single Male Poverty Correlation Chart
The statistical analysis conducted on geographies consisting of 419,228,892 people shows a poor negative correlation between the proportion of Immigrants from South America and poverty level among single males in the United States with a correlation coefficient (R) of -0.115 and weighted average of 12.1%. Similarly, the statistical analysis conducted on geographies consisting of 273,557,518 people shows no correlation between the proportion of Immigrants from Jamaica and poverty level among single males in the United States with a correlation coefficient (R) of 0.045 and weighted average of 13.0%, a difference of 7.4%.
Single Male Poverty Correlation Summary
| Measurement | Immigrants from South America | Immigrants from Jamaica |
| Minimum | 3.2% | 2.1% |
| Maximum | 24.4% | 31.5% |
| Range | 21.3% | 29.4% |
| Mean | 11.6% | 13.0% |
| Median | 11.9% | 12.4% |
| Interquartile 25% (IQ1) | 10.0% | 10.3% |
| Interquartile 75% (IQ3) | 13.3% | 14.7% |
| Interquartile Range (IQR) | 3.2% | 4.4% |
| Standard Deviation (Sample) | 3.2% | 5.4% |
| Standard Deviation (Population) | 3.1% | 5.3% |
Similar Demographics by Single Male Poverty
Demographics Similar to Immigrants from South America by Single Male Poverty
In terms of single male poverty, the demographic groups most similar to Immigrants from South America are Armenian (12.1%, a difference of 0.020%), Immigrants from Colombia (12.1%, a difference of 0.050%), Immigrants from Chile (12.1%, a difference of 0.060%), Immigrants from Czechoslovakia (12.1%, a difference of 0.080%), and Turkish (12.1%, a difference of 0.16%).
| Demographics | Rating | Rank | Single Male Poverty |
| Chileans | 99.5 /100 | #74 | Exceptional 11.9% |
| Uruguayans | 99.4 /100 | #75 | Exceptional 11.9% |
| Immigrants | Northern Africa | 99.4 /100 | #76 | Exceptional 11.9% |
| Immigrants | Malaysia | 99.2 /100 | #77 | Exceptional 12.0% |
| Immigrants | Venezuela | 99.1 /100 | #78 | Exceptional 12.0% |
| Immigrants | Belgium | 99.0 /100 | #79 | Exceptional 12.0% |
| Armenians | 98.7 /100 | #80 | Exceptional 12.1% |
| Immigrants | South America | 98.7 /100 | #81 | Exceptional 12.1% |
| Immigrants | Colombia | 98.6 /100 | #82 | Exceptional 12.1% |
| Immigrants | Chile | 98.6 /100 | #83 | Exceptional 12.1% |
| Immigrants | Czechoslovakia | 98.6 /100 | #84 | Exceptional 12.1% |
| Turks | 98.5 /100 | #85 | Exceptional 12.1% |
| Immigrants | Israel | 98.5 /100 | #86 | Exceptional 12.1% |
| South Americans | 98.5 /100 | #87 | Exceptional 12.1% |
| Immigrants | Eritrea | 98.5 /100 | #88 | Exceptional 12.1% |
Demographics Similar to Immigrants from Jamaica by Single Male Poverty
In terms of single male poverty, the demographic groups most similar to Immigrants from Jamaica are Immigrants from Thailand (13.0%, a difference of 0.010%), Immigrants from South Africa (13.0%, a difference of 0.020%), Arab (13.0%, a difference of 0.040%), Liberian (13.0%, a difference of 0.090%), and Immigrants from England (13.0%, a difference of 0.22%).
| Demographics | Rating | Rank | Single Male Poverty |
| Norwegians | 32.0 /100 | #185 | Fair 12.9% |
| Nigerians | 31.9 /100 | #186 | Fair 12.9% |
| Immigrants | Kuwait | 31.9 /100 | #187 | Fair 12.9% |
| Macedonians | 31.5 /100 | #188 | Fair 12.9% |
| Portuguese | 30.2 /100 | #189 | Fair 12.9% |
| Arabs | 27.0 /100 | #190 | Fair 13.0% |
| Immigrants | Thailand | 26.6 /100 | #191 | Fair 13.0% |
| Immigrants | Jamaica | 26.5 /100 | #192 | Fair 13.0% |
| Immigrants | South Africa | 26.1 /100 | #193 | Fair 13.0% |
| Liberians | 25.2 /100 | #194 | Fair 13.0% |
| Immigrants | England | 23.4 /100 | #195 | Fair 13.0% |
| Immigrants | Grenada | 23.1 /100 | #196 | Fair 13.0% |
| Immigrants | Laos | 23.1 /100 | #197 | Fair 13.0% |
| Lithuanians | 22.1 /100 | #198 | Fair 13.0% |
| Immigrants | Norway | 21.8 /100 | #199 | Fair 13.0% |