Icelander vs Immigrants from Jamaica In Labor Force | Age 45-54
COMPARE
Icelander
Immigrants from Jamaica
In Labor Force | Age 45-54
In Labor Force | Age 45-54 Comparison
Icelanders
Immigrants from Jamaica
82.8%
IN LABOR FORCE | AGE 45-54
51.8/ 100
METRIC RATING
172nd/ 347
METRIC RANK
82.1%
IN LABOR FORCE | AGE 45-54
2.7/ 100
METRIC RATING
224th/ 347
METRIC RANK
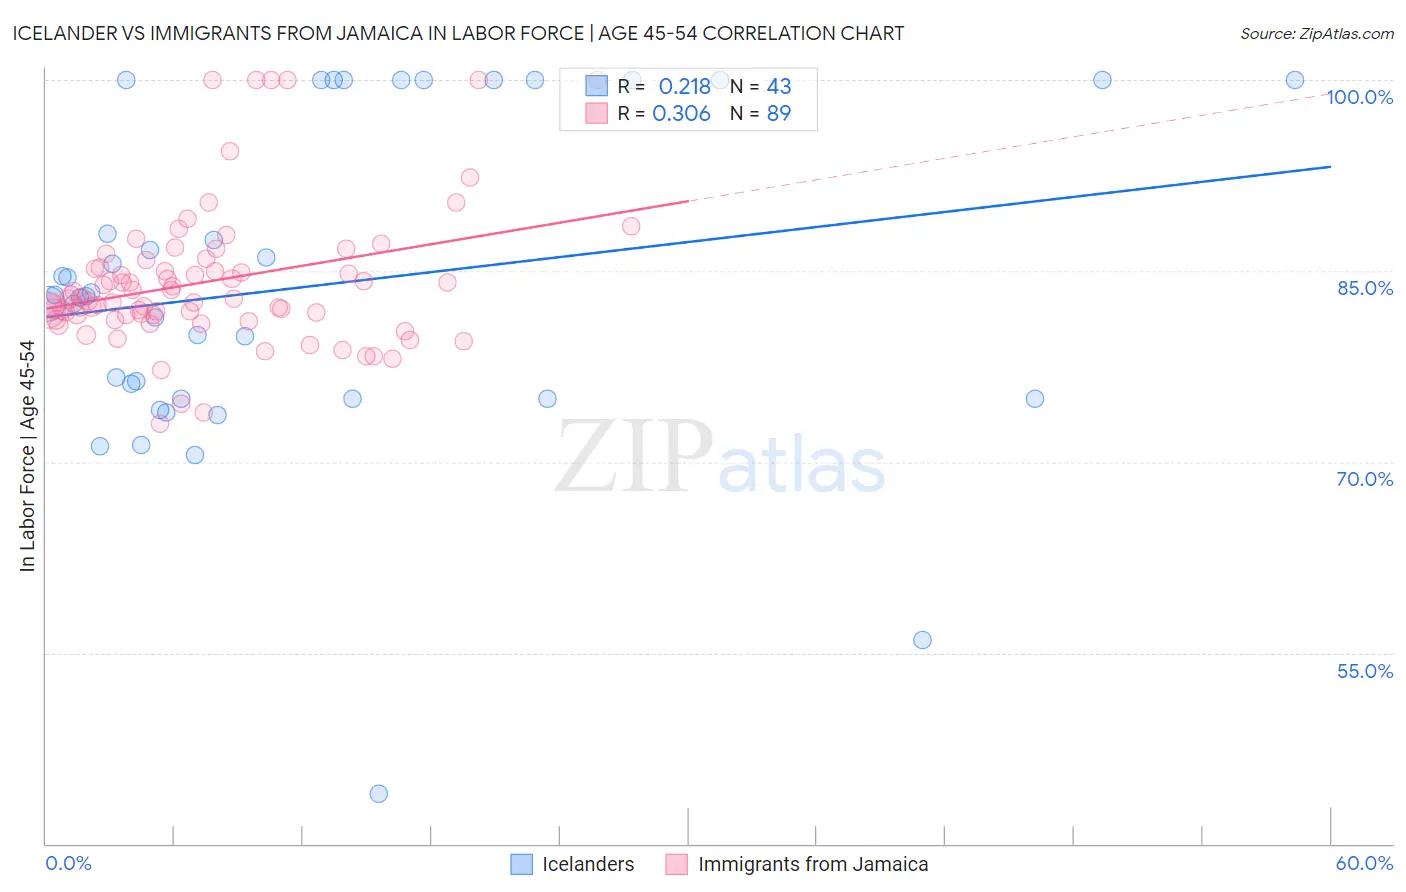
Icelander vs Immigrants from Jamaica In Labor Force | Age 45-54 Correlation Chart
The statistical analysis conducted on geographies consisting of 159,615,670 people shows a weak positive correlation between the proportion of Icelanders and labor force participation rate among population between the ages 45 and 54 in the United States with a correlation coefficient (R) of 0.218 and weighted average of 82.8%. Similarly, the statistical analysis conducted on geographies consisting of 301,584,451 people shows a mild positive correlation between the proportion of Immigrants from Jamaica and labor force participation rate among population between the ages 45 and 54 in the United States with a correlation coefficient (R) of 0.306 and weighted average of 82.1%, a difference of 0.81%.
In Labor Force | Age 45-54 Correlation Summary
| Measurement | Icelander | Immigrants from Jamaica |
| Minimum | 43.9% | 73.0% |
| Maximum | 100.0% | 100.0% |
| Range | 56.1% | 27.0% |
| Mean | 83.8% | 84.2% |
| Median | 83.0% | 82.8% |
| Interquartile 25% (IQ1) | 75.0% | 81.5% |
| Interquartile 75% (IQ3) | 100.0% | 85.5% |
| Interquartile Range (IQR) | 25.0% | 4.0% |
| Standard Deviation (Sample) | 12.8% | 5.6% |
| Standard Deviation (Population) | 12.6% | 5.5% |
Similar Demographics by In Labor Force | Age 45-54
Demographics Similar to Icelanders by In Labor Force | Age 45-54
In terms of in labor force | age 45-54, the demographic groups most similar to Icelanders are Pakistani (82.8%, a difference of 0.010%), Immigrants from Zaire (82.8%, a difference of 0.010%), Nicaraguan (82.8%, a difference of 0.010%), Immigrants from Western Africa (82.8%, a difference of 0.020%), and Costa Rican (82.8%, a difference of 0.020%).
| Demographics | Rating | Rank | In Labor Force | Age 45-54 |
| Immigrants | Sudan | 59.9 /100 | #165 | Average 82.8% |
| Immigrants | South Eastern Asia | 57.4 /100 | #166 | Average 82.8% |
| Swiss | 56.5 /100 | #167 | Average 82.8% |
| Immigrants | South Africa | 55.8 /100 | #168 | Average 82.8% |
| Immigrants | Western Africa | 54.1 /100 | #169 | Average 82.8% |
| Pakistanis | 53.2 /100 | #170 | Average 82.8% |
| Immigrants | Zaire | 52.9 /100 | #171 | Average 82.8% |
| Icelanders | 51.8 /100 | #172 | Average 82.8% |
| Nicaraguans | 50.3 /100 | #173 | Average 82.8% |
| Costa Ricans | 50.0 /100 | #174 | Average 82.8% |
| Immigrants | Liberia | 47.9 /100 | #175 | Average 82.7% |
| Northern Europeans | 46.9 /100 | #176 | Average 82.7% |
| Immigrants | Nicaragua | 44.6 /100 | #177 | Average 82.7% |
| Nigerians | 40.5 /100 | #178 | Average 82.7% |
| Immigrants | Switzerland | 39.4 /100 | #179 | Fair 82.7% |
Demographics Similar to Immigrants from Jamaica by In Labor Force | Age 45-54
In terms of in labor force | age 45-54, the demographic groups most similar to Immigrants from Jamaica are Immigrants from Oceania (82.1%, a difference of 0.020%), Immigrants from Caribbean (82.1%, a difference of 0.020%), Immigrants (82.1%, a difference of 0.030%), Immigrants from Germany (82.1%, a difference of 0.030%), and Panamanian (82.2%, a difference of 0.060%).
| Demographics | Rating | Rank | In Labor Force | Age 45-54 |
| Portuguese | 4.7 /100 | #217 | Tragic 82.2% |
| English | 4.4 /100 | #218 | Tragic 82.2% |
| French | 4.1 /100 | #219 | Tragic 82.2% |
| Bahamians | 3.6 /100 | #220 | Tragic 82.2% |
| Panamanians | 3.5 /100 | #221 | Tragic 82.2% |
| Immigrants | Ecuador | 3.4 /100 | #222 | Tragic 82.2% |
| Immigrants | Immigrants | 3.1 /100 | #223 | Tragic 82.1% |
| Immigrants | Jamaica | 2.7 /100 | #224 | Tragic 82.1% |
| Immigrants | Oceania | 2.5 /100 | #225 | Tragic 82.1% |
| Immigrants | Caribbean | 2.5 /100 | #226 | Tragic 82.1% |
| Immigrants | Germany | 2.4 /100 | #227 | Tragic 82.1% |
| Cape Verdeans | 2.1 /100 | #228 | Tragic 82.1% |
| Immigrants | Burma/Myanmar | 1.9 /100 | #229 | Tragic 82.0% |
| Jamaicans | 1.8 /100 | #230 | Tragic 82.0% |
| Immigrants | Senegal | 1.7 /100 | #231 | Tragic 82.0% |