American vs Belizean Single Male Poverty
COMPARE
American
Belizean
Single Male Poverty
Single Male Poverty Comparison
Americans
Belizeans
15.8%
SINGLE MALE POVERTY
0.0/ 100
METRIC RATING
309th/ 347
METRIC RANK
13.4%
SINGLE MALE POVERTY
2.3/ 100
METRIC RATING
240th/ 347
METRIC RANK
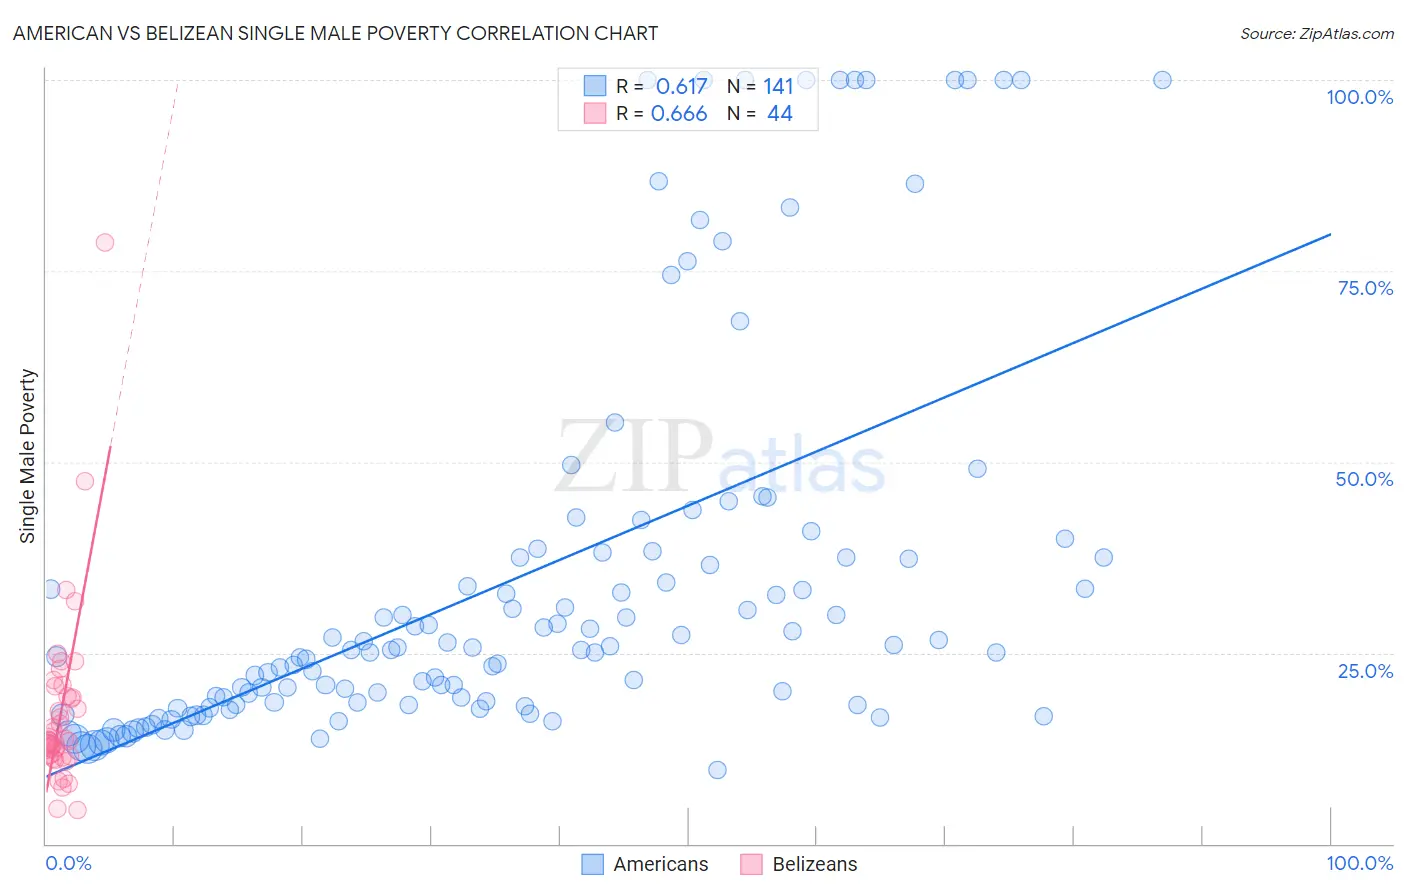
American vs Belizean Single Male Poverty Correlation Chart
The statistical analysis conducted on geographies consisting of 478,139,646 people shows a significant positive correlation between the proportion of Americans and poverty level among single males in the United States with a correlation coefficient (R) of 0.617 and weighted average of 15.8%. Similarly, the statistical analysis conducted on geographies consisting of 138,781,129 people shows a significant positive correlation between the proportion of Belizeans and poverty level among single males in the United States with a correlation coefficient (R) of 0.666 and weighted average of 13.4%, a difference of 17.6%.
Single Male Poverty Correlation Summary
| Measurement | American | Belizean |
| Minimum | 9.7% | 4.5% |
| Maximum | 100.0% | 78.7% |
| Range | 90.3% | 74.2% |
| Mean | 34.5% | 17.5% |
| Median | 25.4% | 13.4% |
| Interquartile 25% (IQ1) | 18.2% | 11.5% |
| Interquartile 75% (IQ3) | 37.5% | 20.0% |
| Interquartile Range (IQR) | 19.3% | 8.5% |
| Standard Deviation (Sample) | 25.3% | 12.3% |
| Standard Deviation (Population) | 25.2% | 12.2% |
Similar Demographics by Single Male Poverty
Demographics Similar to Americans by Single Male Poverty
In terms of single male poverty, the demographic groups most similar to Americans are Potawatomi (15.8%, a difference of 0.17%), Ute (15.7%, a difference of 0.73%), Yakama (15.9%, a difference of 0.87%), Seminole (16.0%, a difference of 1.4%), and Comanche (16.0%, a difference of 1.4%).
| Demographics | Rating | Rank | Single Male Poverty |
| Alsatians | 0.0 /100 | #302 | Tragic 15.2% |
| Aleuts | 0.0 /100 | #303 | Tragic 15.4% |
| Alaska Natives | 0.0 /100 | #304 | Tragic 15.4% |
| Blackfeet | 0.0 /100 | #305 | Tragic 15.5% |
| Pennsylvania Germans | 0.0 /100 | #306 | Tragic 15.6% |
| Ute | 0.0 /100 | #307 | Tragic 15.7% |
| Potawatomi | 0.0 /100 | #308 | Tragic 15.8% |
| Americans | 0.0 /100 | #309 | Tragic 15.8% |
| Yakama | 0.0 /100 | #310 | Tragic 15.9% |
| Seminole | 0.0 /100 | #311 | Tragic 16.0% |
| Comanche | 0.0 /100 | #312 | Tragic 16.0% |
| Cherokee | 0.0 /100 | #313 | Tragic 16.1% |
| Alaskan Athabascans | 0.0 /100 | #314 | Tragic 16.1% |
| Cheyenne | 0.0 /100 | #315 | Tragic 16.1% |
| Dutch West Indians | 0.0 /100 | #316 | Tragic 16.1% |
Demographics Similar to Belizeans by Single Male Poverty
In terms of single male poverty, the demographic groups most similar to Belizeans are Immigrants from Germany (13.4%, a difference of 0.11%), Carpatho Rusyn (13.4%, a difference of 0.12%), Barbadian (13.4%, a difference of 0.17%), Czechoslovakian (13.4%, a difference of 0.30%), and Immigrants from Ghana (13.4%, a difference of 0.39%).
| Demographics | Rating | Rank | Single Male Poverty |
| British | 4.0 /100 | #233 | Tragic 13.3% |
| Canadians | 4.0 /100 | #234 | Tragic 13.3% |
| Bangladeshis | 3.7 /100 | #235 | Tragic 13.3% |
| Luxembourgers | 3.6 /100 | #236 | Tragic 13.4% |
| British West Indians | 3.4 /100 | #237 | Tragic 13.4% |
| Immigrants | Ghana | 3.2 /100 | #238 | Tragic 13.4% |
| Czechoslovakians | 3.0 /100 | #239 | Tragic 13.4% |
| Belizeans | 2.3 /100 | #240 | Tragic 13.4% |
| Immigrants | Germany | 2.1 /100 | #241 | Tragic 13.4% |
| Carpatho Rusyns | 2.1 /100 | #242 | Tragic 13.4% |
| Barbadians | 2.1 /100 | #243 | Tragic 13.4% |
| Immigrants | Senegal | 1.7 /100 | #244 | Tragic 13.5% |
| Immigrants | Latin America | 1.3 /100 | #245 | Tragic 13.5% |
| Immigrants | Micronesia | 1.2 /100 | #246 | Tragic 13.5% |
| Belgians | 1.2 /100 | #247 | Tragic 13.5% |