Houma vs Immigrants from Singapore Single Father Poverty
COMPARE
Houma
Immigrants from Singapore
Single Father Poverty
Single Father Poverty Comparison
Houma
Immigrants from Singapore
26.7%
SINGLE FATHER POVERTY
0.0/ 100
METRIC RATING
340th/ 347
METRIC RANK
14.3%
SINGLE FATHER POVERTY
100.0/ 100
METRIC RATING
20th/ 347
METRIC RANK
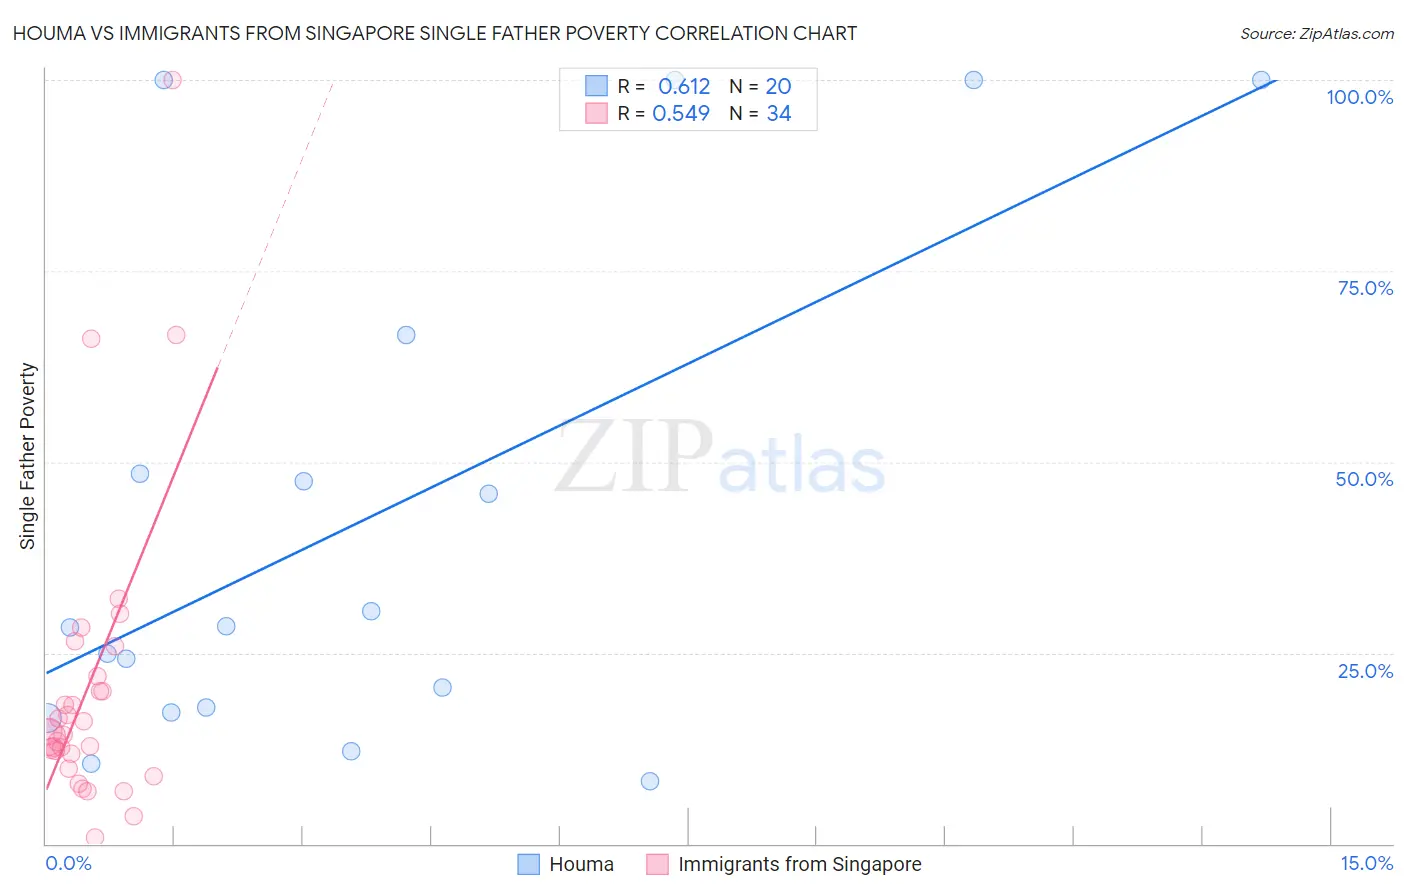
Houma vs Immigrants from Singapore Single Father Poverty Correlation Chart
The statistical analysis conducted on geographies consisting of 35,236,352 people shows a significant positive correlation between the proportion of Houma and poverty level among single fathers in the United States with a correlation coefficient (R) of 0.612 and weighted average of 26.7%. Similarly, the statistical analysis conducted on geographies consisting of 118,546,936 people shows a substantial positive correlation between the proportion of Immigrants from Singapore and poverty level among single fathers in the United States with a correlation coefficient (R) of 0.549 and weighted average of 14.3%, a difference of 87.5%.
Single Father Poverty Correlation Summary
| Measurement | Houma | Immigrants from Singapore |
| Minimum | 8.2% | 0.84% |
| Maximum | 100.0% | 100.0% |
| Range | 91.8% | 99.2% |
| Mean | 42.4% | 20.8% |
| Median | 28.3% | 14.5% |
| Interquartile 25% (IQ1) | 17.5% | 11.8% |
| Interquartile 75% (IQ3) | 57.6% | 21.9% |
| Interquartile Range (IQR) | 40.0% | 10.1% |
| Standard Deviation (Sample) | 32.9% | 19.9% |
| Standard Deviation (Population) | 32.1% | 19.6% |
Similar Demographics by Single Father Poverty
Demographics Similar to Houma by Single Father Poverty
In terms of single father poverty, the demographic groups most similar to Houma are Hopi (27.2%, a difference of 1.6%), Yuman (28.4%, a difference of 6.2%), Lumbee (28.5%, a difference of 6.5%), Navajo (29.2%, a difference of 9.3%), and Apache (24.2%, a difference of 10.3%).
| Demographics | Rating | Rank | Single Father Poverty |
| Natives/Alaskans | 0.0 /100 | #333 | Tragic 22.4% |
| Kiowa | 0.0 /100 | #334 | Tragic 22.5% |
| Shoshone | 0.0 /100 | #335 | Tragic 22.9% |
| Cajuns | 0.0 /100 | #336 | Tragic 23.1% |
| Sioux | 0.0 /100 | #337 | Tragic 23.9% |
| Arapaho | 0.0 /100 | #338 | Tragic 24.0% |
| Apache | 0.0 /100 | #339 | Tragic 24.2% |
| Houma | 0.0 /100 | #340 | Tragic 26.7% |
| Hopi | 0.0 /100 | #341 | Tragic 27.2% |
| Yuman | 0.0 /100 | #342 | Tragic 28.4% |
| Lumbee | 0.0 /100 | #343 | Tragic 28.5% |
| Navajo | 0.0 /100 | #344 | Tragic 29.2% |
| Crow | 0.0 /100 | #345 | Tragic 30.3% |
| Puerto Ricans | 0.0 /100 | #346 | Tragic 31.5% |
| Yup'ik | 0.0 /100 | #347 | Tragic 32.5% |
Demographics Similar to Immigrants from Singapore by Single Father Poverty
In terms of single father poverty, the demographic groups most similar to Immigrants from Singapore are Immigrants from Iraq (14.3%, a difference of 0.040%), Soviet Union (14.3%, a difference of 0.090%), Immigrants from Afghanistan (14.3%, a difference of 0.090%), Immigrants from Hong Kong (14.2%, a difference of 0.11%), and Taiwanese (14.3%, a difference of 0.43%).
| Demographics | Rating | Rank | Single Father Poverty |
| Immigrants | Philippines | 100.0 /100 | #13 | Exceptional 14.0% |
| Immigrants | Vietnam | 100.0 /100 | #14 | Exceptional 14.1% |
| Sri Lankans | 100.0 /100 | #15 | Exceptional 14.2% |
| Immigrants | Iran | 100.0 /100 | #16 | Exceptional 14.2% |
| Immigrants | Hong Kong | 100.0 /100 | #17 | Exceptional 14.2% |
| Soviet Union | 100.0 /100 | #18 | Exceptional 14.3% |
| Immigrants | Iraq | 100.0 /100 | #19 | Exceptional 14.3% |
| Immigrants | Singapore | 100.0 /100 | #20 | Exceptional 14.3% |
| Immigrants | Afghanistan | 100.0 /100 | #21 | Exceptional 14.3% |
| Taiwanese | 100.0 /100 | #22 | Exceptional 14.3% |
| Immigrants | Egypt | 100.0 /100 | #23 | Exceptional 14.4% |
| Immigrants | South Eastern Asia | 100.0 /100 | #24 | Exceptional 14.4% |
| Iranians | 100.0 /100 | #25 | Exceptional 14.4% |
| Spanish American Indians | 100.0 /100 | #26 | Exceptional 14.4% |
| Nepalese | 100.0 /100 | #27 | Exceptional 14.4% |