Houma vs Immigrants from Chile Single Father Poverty
COMPARE
Houma
Immigrants from Chile
Single Father Poverty
Single Father Poverty Comparison
Houma
Immigrants from Chile
26.7%
SINGLE FATHER POVERTY
0.0/ 100
METRIC RATING
340th/ 347
METRIC RANK
15.7%
SINGLE FATHER POVERTY
96.9/ 100
METRIC RATING
100th/ 347
METRIC RANK
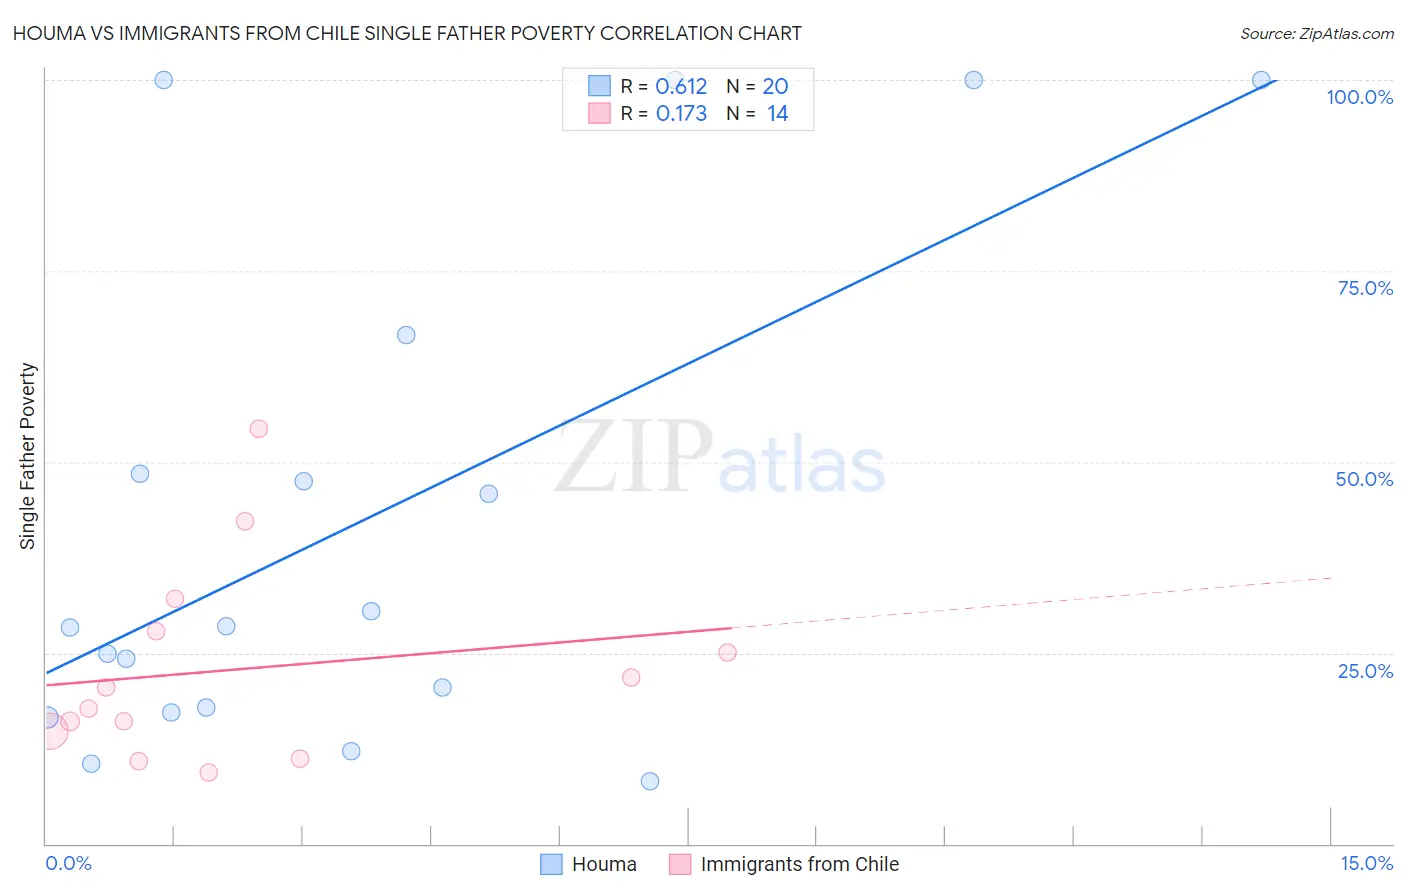
Houma vs Immigrants from Chile Single Father Poverty Correlation Chart
The statistical analysis conducted on geographies consisting of 35,236,352 people shows a significant positive correlation between the proportion of Houma and poverty level among single fathers in the United States with a correlation coefficient (R) of 0.612 and weighted average of 26.7%. Similarly, the statistical analysis conducted on geographies consisting of 186,328,392 people shows a poor positive correlation between the proportion of Immigrants from Chile and poverty level among single fathers in the United States with a correlation coefficient (R) of 0.173 and weighted average of 15.7%, a difference of 70.6%.
Single Father Poverty Correlation Summary
| Measurement | Houma | Immigrants from Chile |
| Minimum | 8.2% | 9.3% |
| Maximum | 100.0% | 54.3% |
| Range | 91.8% | 45.0% |
| Mean | 42.4% | 22.8% |
| Median | 28.3% | 19.0% |
| Interquartile 25% (IQ1) | 17.5% | 14.7% |
| Interquartile 75% (IQ3) | 57.6% | 27.9% |
| Interquartile Range (IQR) | 40.0% | 13.2% |
| Standard Deviation (Sample) | 32.9% | 12.8% |
| Standard Deviation (Population) | 32.1% | 12.4% |
Similar Demographics by Single Father Poverty
Demographics Similar to Houma by Single Father Poverty
In terms of single father poverty, the demographic groups most similar to Houma are Hopi (27.2%, a difference of 1.6%), Yuman (28.4%, a difference of 6.2%), Lumbee (28.5%, a difference of 6.5%), Navajo (29.2%, a difference of 9.3%), and Apache (24.2%, a difference of 10.3%).
| Demographics | Rating | Rank | Single Father Poverty |
| Natives/Alaskans | 0.0 /100 | #333 | Tragic 22.4% |
| Kiowa | 0.0 /100 | #334 | Tragic 22.5% |
| Shoshone | 0.0 /100 | #335 | Tragic 22.9% |
| Cajuns | 0.0 /100 | #336 | Tragic 23.1% |
| Sioux | 0.0 /100 | #337 | Tragic 23.9% |
| Arapaho | 0.0 /100 | #338 | Tragic 24.0% |
| Apache | 0.0 /100 | #339 | Tragic 24.2% |
| Houma | 0.0 /100 | #340 | Tragic 26.7% |
| Hopi | 0.0 /100 | #341 | Tragic 27.2% |
| Yuman | 0.0 /100 | #342 | Tragic 28.4% |
| Lumbee | 0.0 /100 | #343 | Tragic 28.5% |
| Navajo | 0.0 /100 | #344 | Tragic 29.2% |
| Crow | 0.0 /100 | #345 | Tragic 30.3% |
| Puerto Ricans | 0.0 /100 | #346 | Tragic 31.5% |
| Yup'ik | 0.0 /100 | #347 | Tragic 32.5% |
Demographics Similar to Immigrants from Chile by Single Father Poverty
In terms of single father poverty, the demographic groups most similar to Immigrants from Chile are Fijian (15.7%, a difference of 0.030%), Chilean (15.7%, a difference of 0.19%), Immigrants from Middle Africa (15.6%, a difference of 0.22%), South American Indian (15.7%, a difference of 0.25%), and Australian (15.7%, a difference of 0.28%).
| Demographics | Rating | Rank | Single Father Poverty |
| Basques | 98.4 /100 | #93 | Exceptional 15.5% |
| Immigrants | Uruguay | 98.2 /100 | #94 | Exceptional 15.6% |
| Immigrants | Kazakhstan | 98.2 /100 | #95 | Exceptional 15.6% |
| Immigrants | Belgium | 98.1 /100 | #96 | Exceptional 15.6% |
| Yaqui | 98.1 /100 | #97 | Exceptional 15.6% |
| Zimbabweans | 98.1 /100 | #98 | Exceptional 15.6% |
| Immigrants | Middle Africa | 97.4 /100 | #99 | Exceptional 15.6% |
| Immigrants | Chile | 96.9 /100 | #100 | Exceptional 15.7% |
| Fijians | 96.8 /100 | #101 | Exceptional 15.7% |
| Chileans | 96.4 /100 | #102 | Exceptional 15.7% |
| South American Indians | 96.2 /100 | #103 | Exceptional 15.7% |
| Australians | 96.1 /100 | #104 | Exceptional 15.7% |
| Immigrants | Australia | 96.1 /100 | #105 | Exceptional 15.7% |
| Immigrants | Poland | 95.8 /100 | #106 | Exceptional 15.7% |
| Native Hawaiians | 95.8 /100 | #107 | Exceptional 15.7% |