Houma vs Immigrants from Turkey Single Father Poverty
COMPARE
Houma
Immigrants from Turkey
Single Father Poverty
Single Father Poverty Comparison
Houma
Immigrants from Turkey
26.7%
SINGLE FATHER POVERTY
0.0/ 100
METRIC RATING
340th/ 347
METRIC RANK
15.3%
SINGLE FATHER POVERTY
99.5/ 100
METRIC RATING
75th/ 347
METRIC RANK
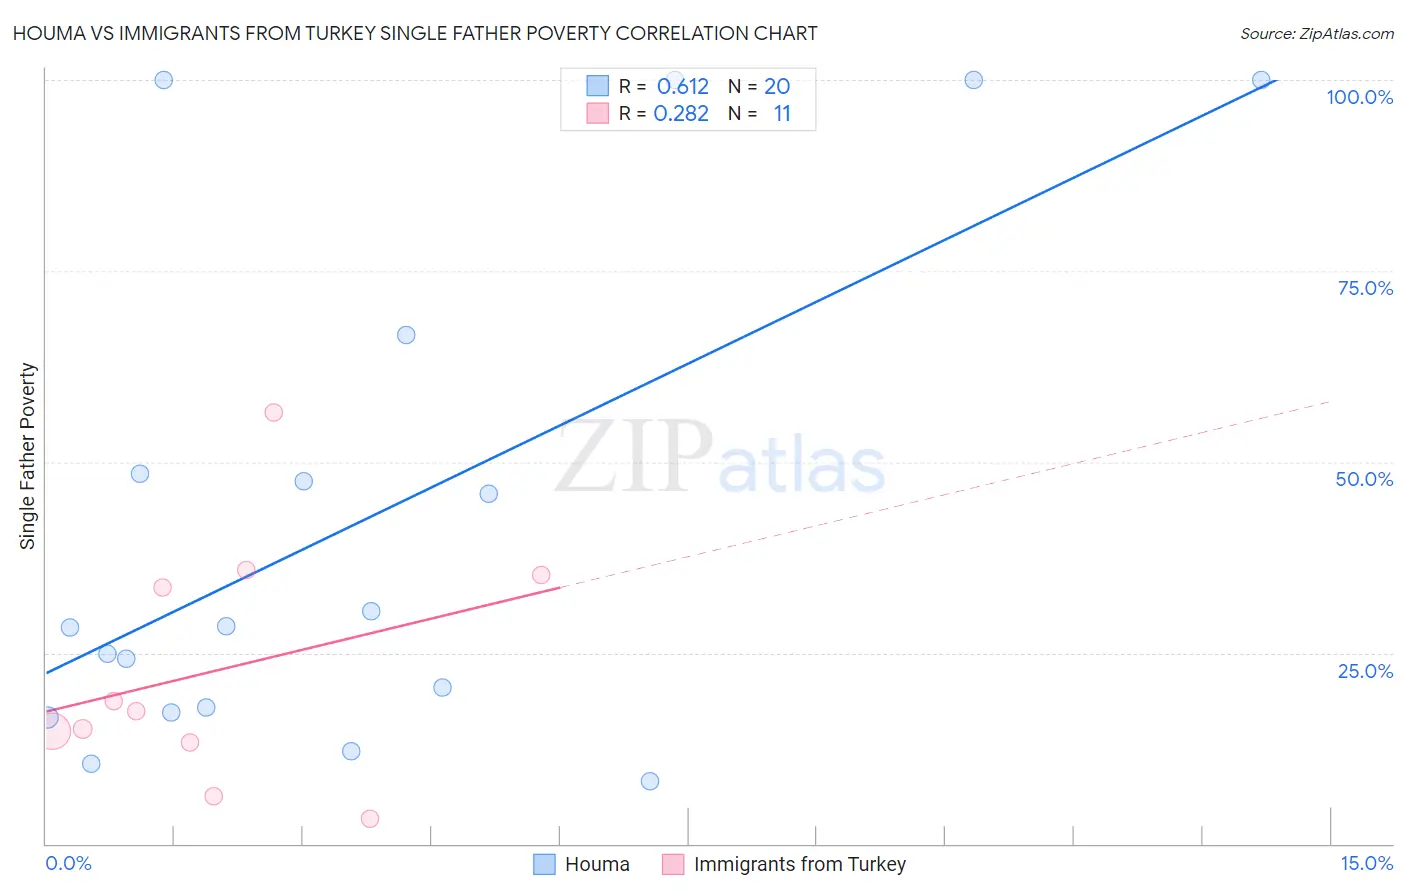
Houma vs Immigrants from Turkey Single Father Poverty Correlation Chart
The statistical analysis conducted on geographies consisting of 35,236,352 people shows a significant positive correlation between the proportion of Houma and poverty level among single fathers in the United States with a correlation coefficient (R) of 0.612 and weighted average of 26.7%. Similarly, the statistical analysis conducted on geographies consisting of 182,600,036 people shows a weak positive correlation between the proportion of Immigrants from Turkey and poverty level among single fathers in the United States with a correlation coefficient (R) of 0.282 and weighted average of 15.3%, a difference of 74.5%.
Single Father Poverty Correlation Summary
| Measurement | Houma | Immigrants from Turkey |
| Minimum | 8.2% | 3.3% |
| Maximum | 100.0% | 56.5% |
| Range | 91.8% | 53.2% |
| Mean | 42.4% | 22.7% |
| Median | 28.3% | 17.3% |
| Interquartile 25% (IQ1) | 17.5% | 13.3% |
| Interquartile 75% (IQ3) | 57.6% | 35.1% |
| Interquartile Range (IQR) | 40.0% | 21.8% |
| Standard Deviation (Sample) | 32.9% | 15.8% |
| Standard Deviation (Population) | 32.1% | 15.1% |
Similar Demographics by Single Father Poverty
Demographics Similar to Houma by Single Father Poverty
In terms of single father poverty, the demographic groups most similar to Houma are Hopi (27.2%, a difference of 1.6%), Yuman (28.4%, a difference of 6.2%), Lumbee (28.5%, a difference of 6.5%), Navajo (29.2%, a difference of 9.3%), and Apache (24.2%, a difference of 10.3%).
| Demographics | Rating | Rank | Single Father Poverty |
| Natives/Alaskans | 0.0 /100 | #333 | Tragic 22.4% |
| Kiowa | 0.0 /100 | #334 | Tragic 22.5% |
| Shoshone | 0.0 /100 | #335 | Tragic 22.9% |
| Cajuns | 0.0 /100 | #336 | Tragic 23.1% |
| Sioux | 0.0 /100 | #337 | Tragic 23.9% |
| Arapaho | 0.0 /100 | #338 | Tragic 24.0% |
| Apache | 0.0 /100 | #339 | Tragic 24.2% |
| Houma | 0.0 /100 | #340 | Tragic 26.7% |
| Hopi | 0.0 /100 | #341 | Tragic 27.2% |
| Yuman | 0.0 /100 | #342 | Tragic 28.4% |
| Lumbee | 0.0 /100 | #343 | Tragic 28.5% |
| Navajo | 0.0 /100 | #344 | Tragic 29.2% |
| Crow | 0.0 /100 | #345 | Tragic 30.3% |
| Puerto Ricans | 0.0 /100 | #346 | Tragic 31.5% |
| Yup'ik | 0.0 /100 | #347 | Tragic 32.5% |
Demographics Similar to Immigrants from Turkey by Single Father Poverty
In terms of single father poverty, the demographic groups most similar to Immigrants from Turkey are Maltese (15.3%, a difference of 0.020%), Kenyan (15.3%, a difference of 0.060%), Immigrants from Japan (15.3%, a difference of 0.080%), Immigrants from Peru (15.3%, a difference of 0.090%), and Tlingit-Haida (15.3%, a difference of 0.14%).
| Demographics | Rating | Rank | Single Father Poverty |
| Immigrants | Cameroon | 99.7 /100 | #68 | Exceptional 15.2% |
| Japanese | 99.7 /100 | #69 | Exceptional 15.2% |
| Mongolians | 99.7 /100 | #70 | Exceptional 15.3% |
| Immigrants | Brazil | 99.6 /100 | #71 | Exceptional 15.3% |
| Immigrants | Lithuania | 99.6 /100 | #72 | Exceptional 15.3% |
| Kenyans | 99.6 /100 | #73 | Exceptional 15.3% |
| Maltese | 99.6 /100 | #74 | Exceptional 15.3% |
| Immigrants | Turkey | 99.5 /100 | #75 | Exceptional 15.3% |
| Immigrants | Japan | 99.5 /100 | #76 | Exceptional 15.3% |
| Immigrants | Peru | 99.5 /100 | #77 | Exceptional 15.3% |
| Tlingit-Haida | 99.5 /100 | #78 | Exceptional 15.3% |
| Immigrants | Northern Africa | 99.5 /100 | #79 | Exceptional 15.3% |
| Armenians | 99.4 /100 | #80 | Exceptional 15.4% |
| Immigrants | Congo | 99.4 /100 | #81 | Exceptional 15.4% |
| Immigrants | Ukraine | 99.4 /100 | #82 | Exceptional 15.4% |